Learnings from running hundreds of data incidents at SYNQ
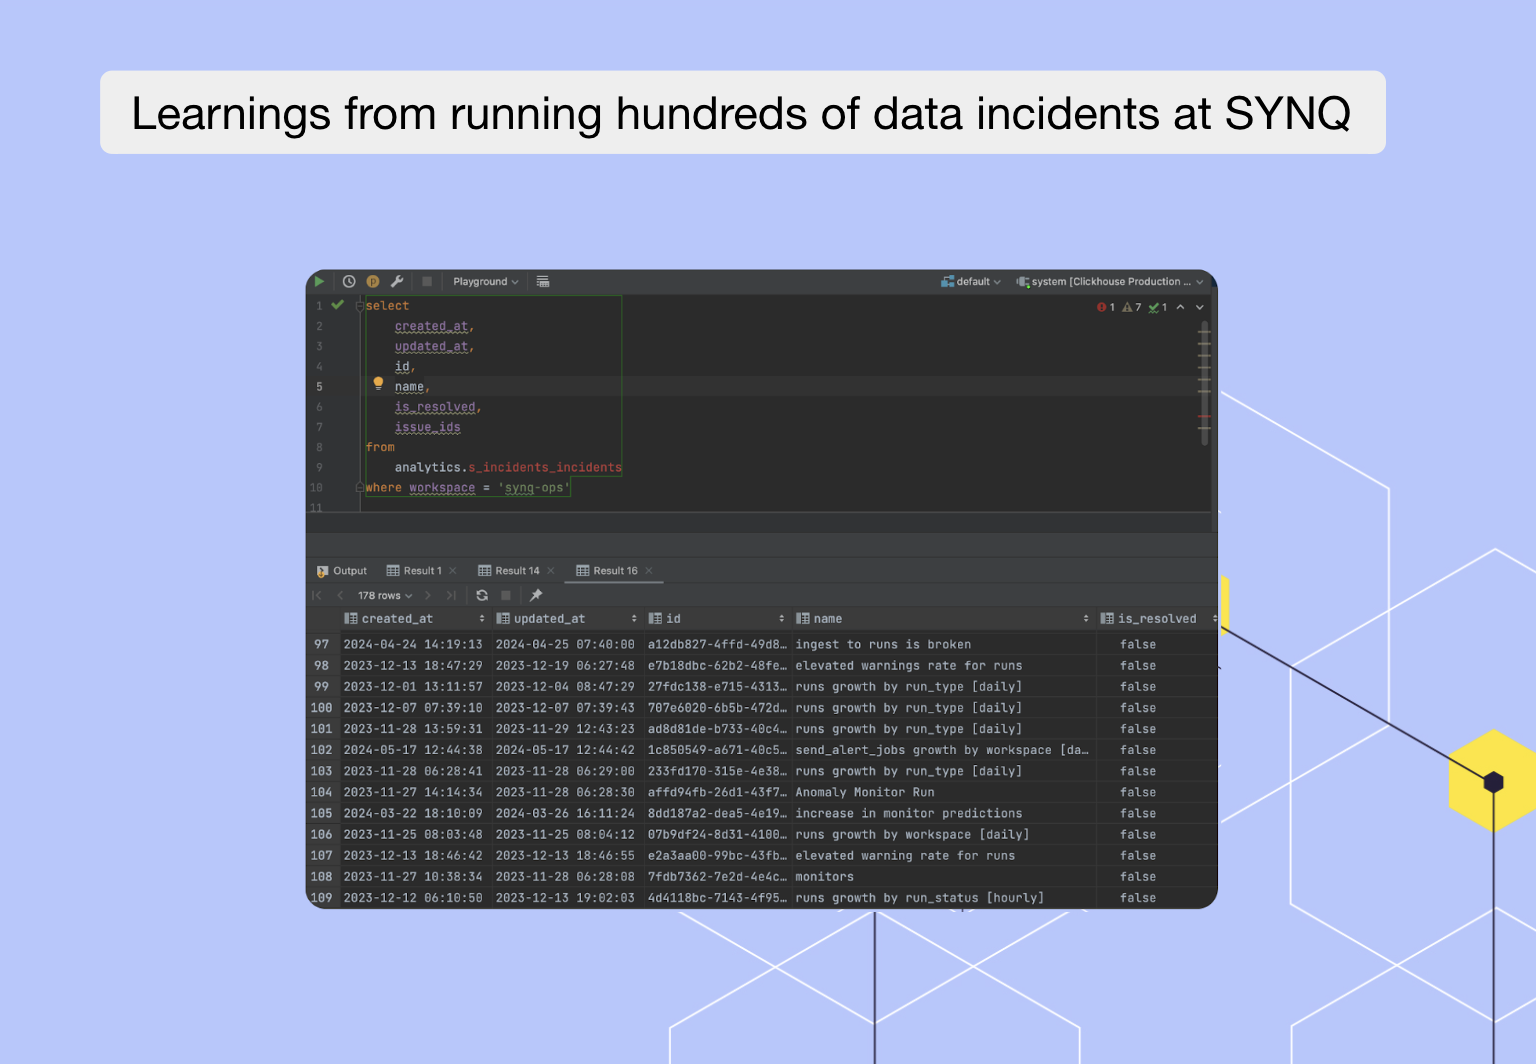
Earlier this year, we released our long-anticipated Incident Management functionality, allowing data teams to treat their most important issues as incidents. Naturally, we decided to use this ourselves, and hundreds of incidents later, we learned a thing or two about running data incidents.
Before diving in, our philosophy is that incidents are different from issues. A dbt model failing may be an early warning sign of a trivial issue or indicate that your entire pipeline is down. You need context to make this call – something the data practitioners who are in the weeds often do.
“We think about incidents as something that must be fixed immediately. On the other hand, issues may indicate something wrong but don’t require immediate attention. Before SYNQ, we didn’t declare incidents in the data team, which could create an overwhelming feeling that important issues would get lost in the noise” – Stijn, Data Engineering Manager, Aiven.
In this post, we’ll dive into the following topics
- Incident management at SYNQ by the numbers
- Stage One: Issue detection and alerting
- Stage two: Triaging issues and declaring incidents
- Stage three: Handling the incident
- Stage four: Post-incident analysis
Incident management at SYNQ by the numbers
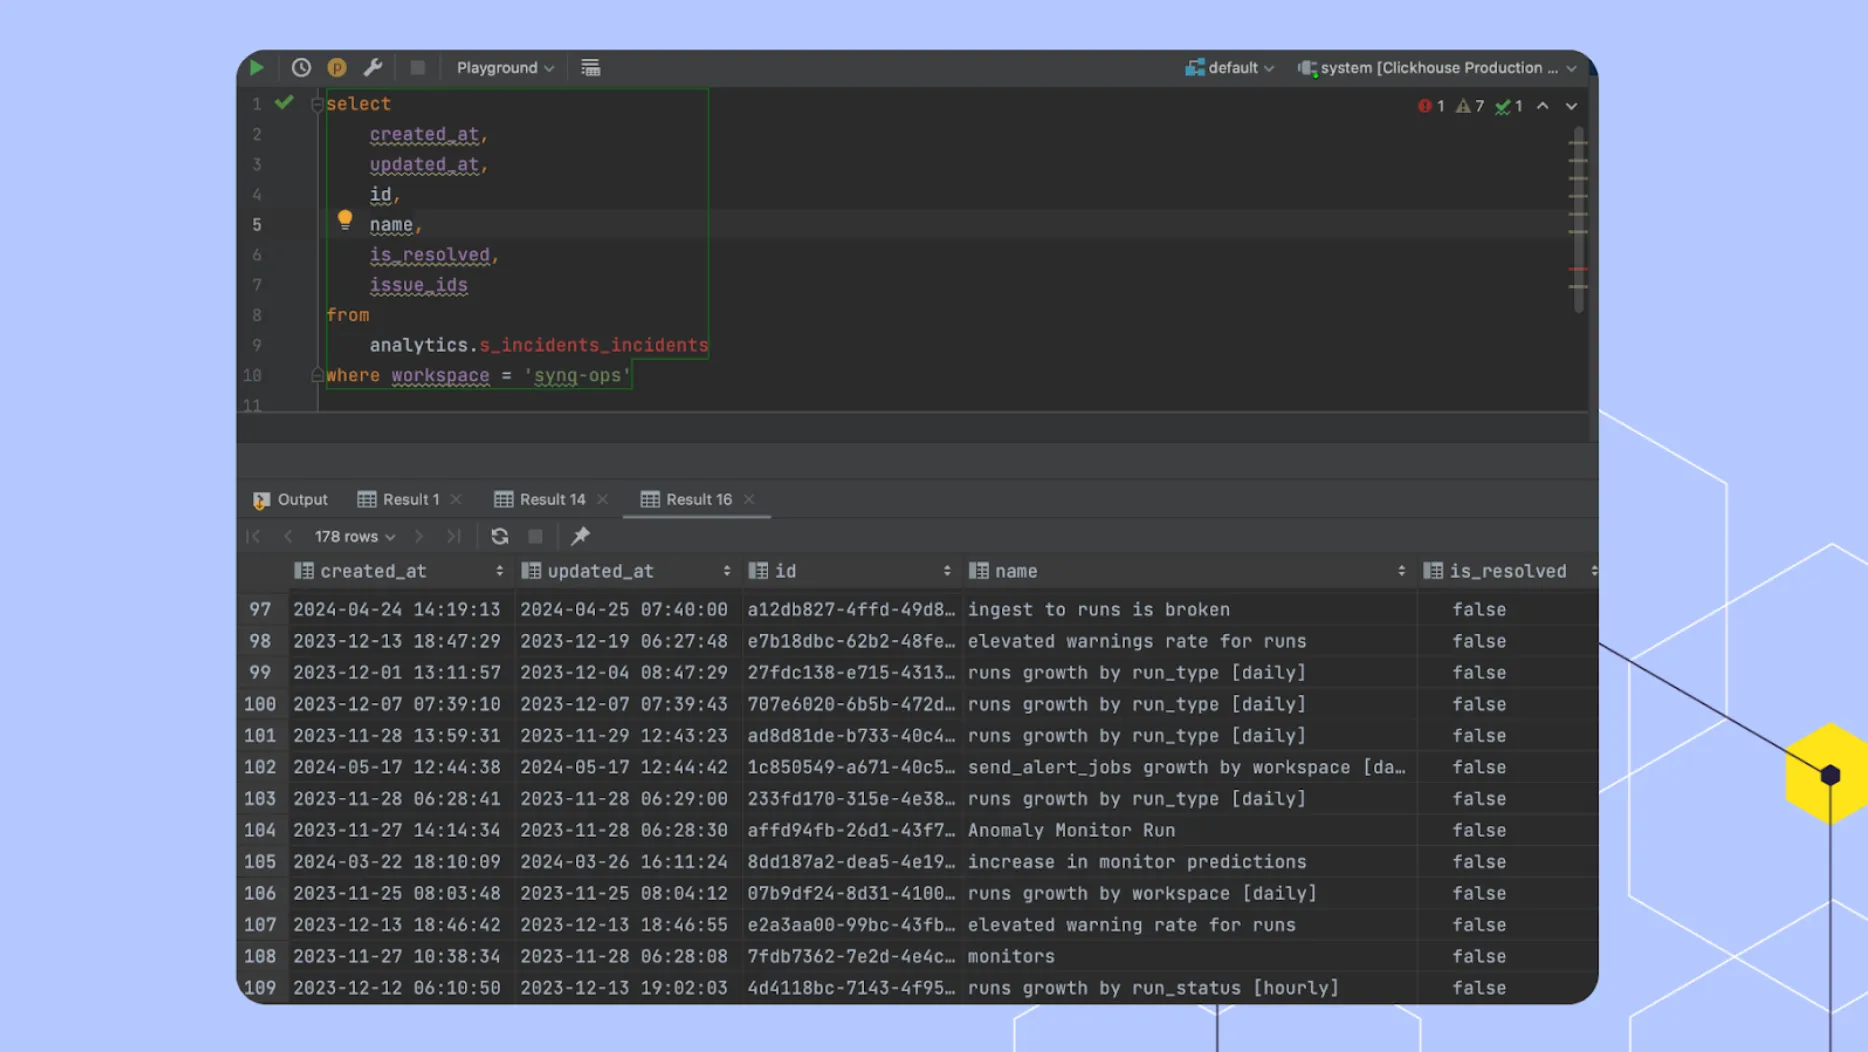
Declaring incidents leaves a trace of useful information stored in our ClickHouse data warehouse, most of which we also make available to our customers for them to deep-dive into and uncover patterns. With this data, we can look at key metrics behind each incident declared.
In 2024 we:
- Detected thousands of issues across SYNQ monitors and dbt tests – a higher number than we’d recommend for most customers, but reflective of us testing and tweaking new monitor types, some firing hundreds of times.
- Declared 202 incidents, of which 114 were closed and 86 were canceled.
- Resolved incidents with a median time to resolution of 18 hours and 25 minutes. 75% of incidents were resolved within 70 hours.
Stage One: Issue detection and alerting
An incident begins when something goes wrong—whether it’s a critical dbt job failing, a table no longer receiving new data, or an SQL test for data integrity breaking down. At this point, it’s still just an issue, and our system needs to accomplish three key objectives:
- Detect the issue promptly.
- Alert the appropriate person.
- Provide relevant context for resolution.
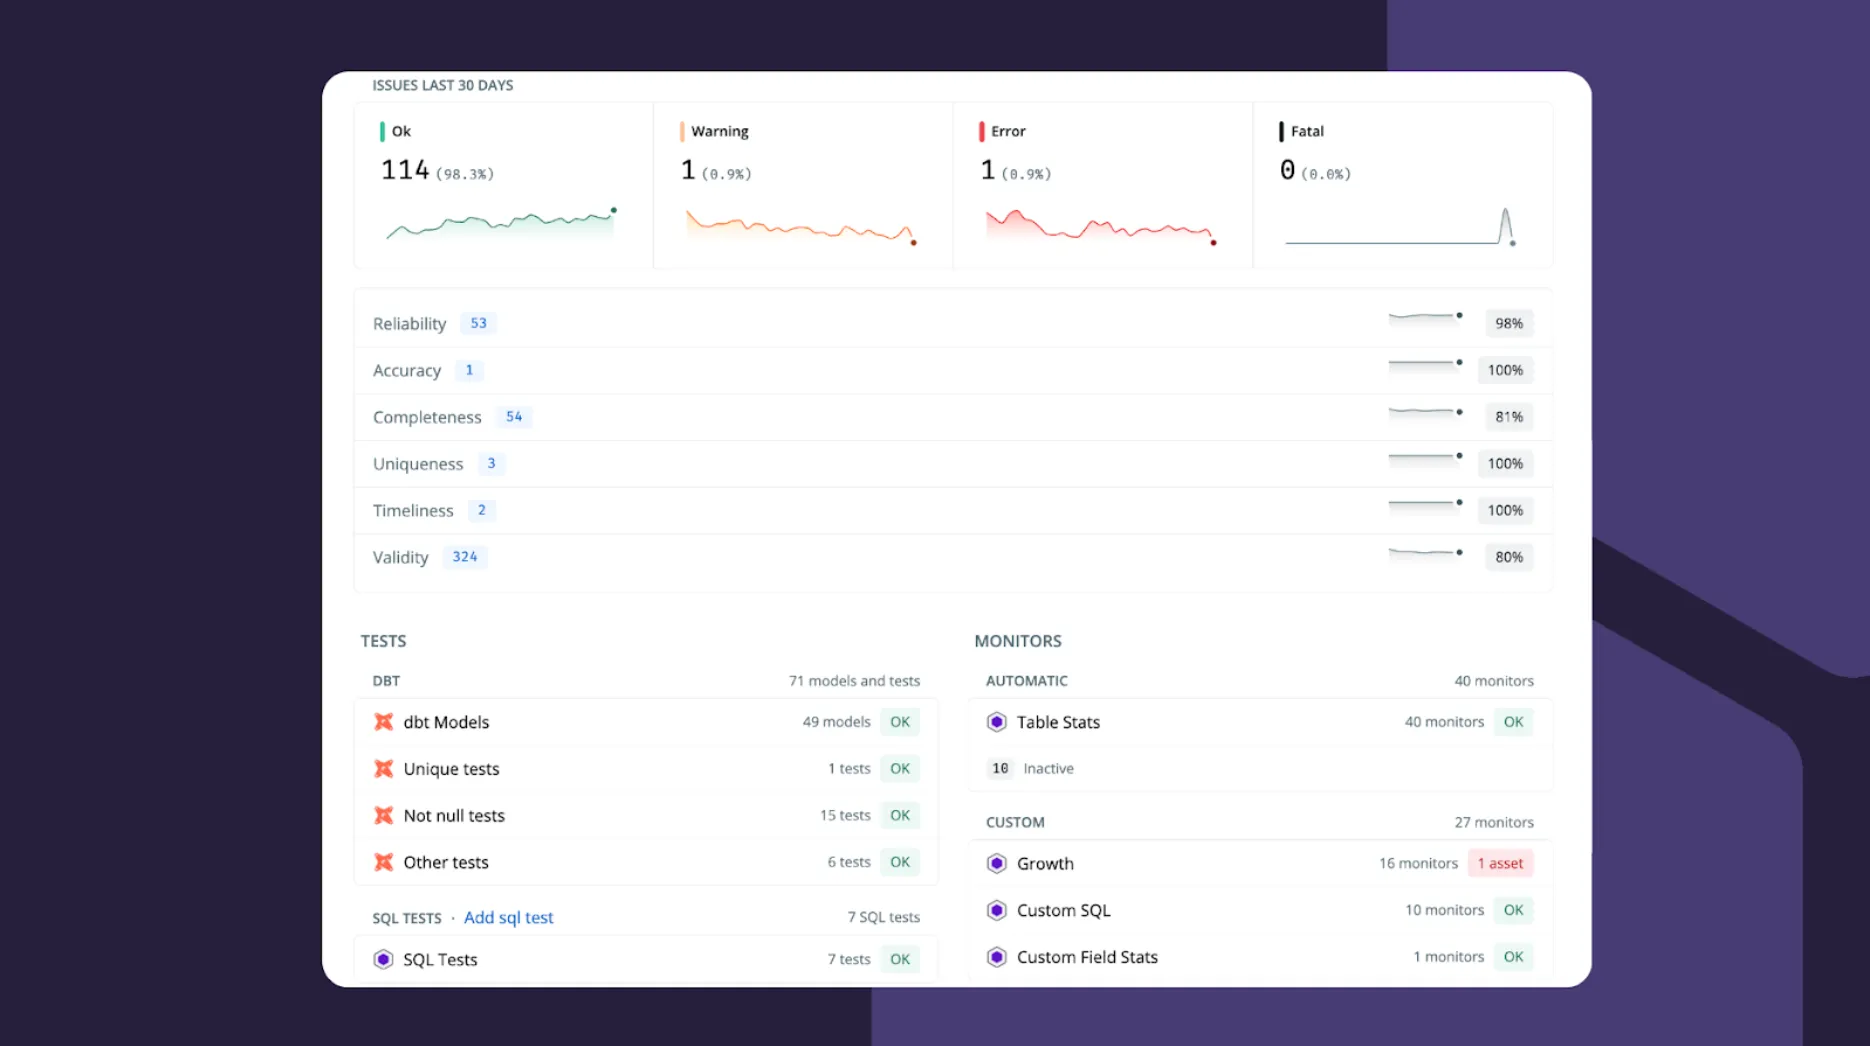
At SYNQ, we run SYNQ on SYNQ. We use SYNQ alongside dbt to monitor our ClickHouse and Postgres tables to detect if a customer integration has stopped working, a customer is sending less data than expected, or if there is a system-wide issue. We have a relatively small stack – 233 ClickHouse tables, 49 dbt models, and 72 Postgres tables – but it’s business-critical, and issues can directly impact our customers. To be at the forefront of this, we’ve set up the following tests and SYNQ monitors:
- 21 dbt tests – detect ‘known unknowns’ by checking for inconsistencies such as not_null, uniqueness, and empty strings
- 7 SQL tests – detect ‘known unknowns’ by checking for inconsistencies such as accepted values, empty state, and not null on tables not materialized through dbt
- 40 table stats monitors – detect ‘unknown unknowns’ such as a sudden drop in the row count of a table or data arriving later than expected with a self-learning threshold. These monitors are automatically applied to key assets such as all dbt sources and specific ClickHouse schemas, ensuring new assets that are added are automatically monitored
- 27 custom monitors – detect issues that are harder to encode through dbt tests, such as a sudden drop in the monitor count for a specific customer
We use Data Products to define ownership and get an overview of the state of our data Stack from a use-case-centric point of view. We have 15 data products across 6 domains, such as Kernel (core systems), Marts (analytics & usage), and GTM (website and CRM).
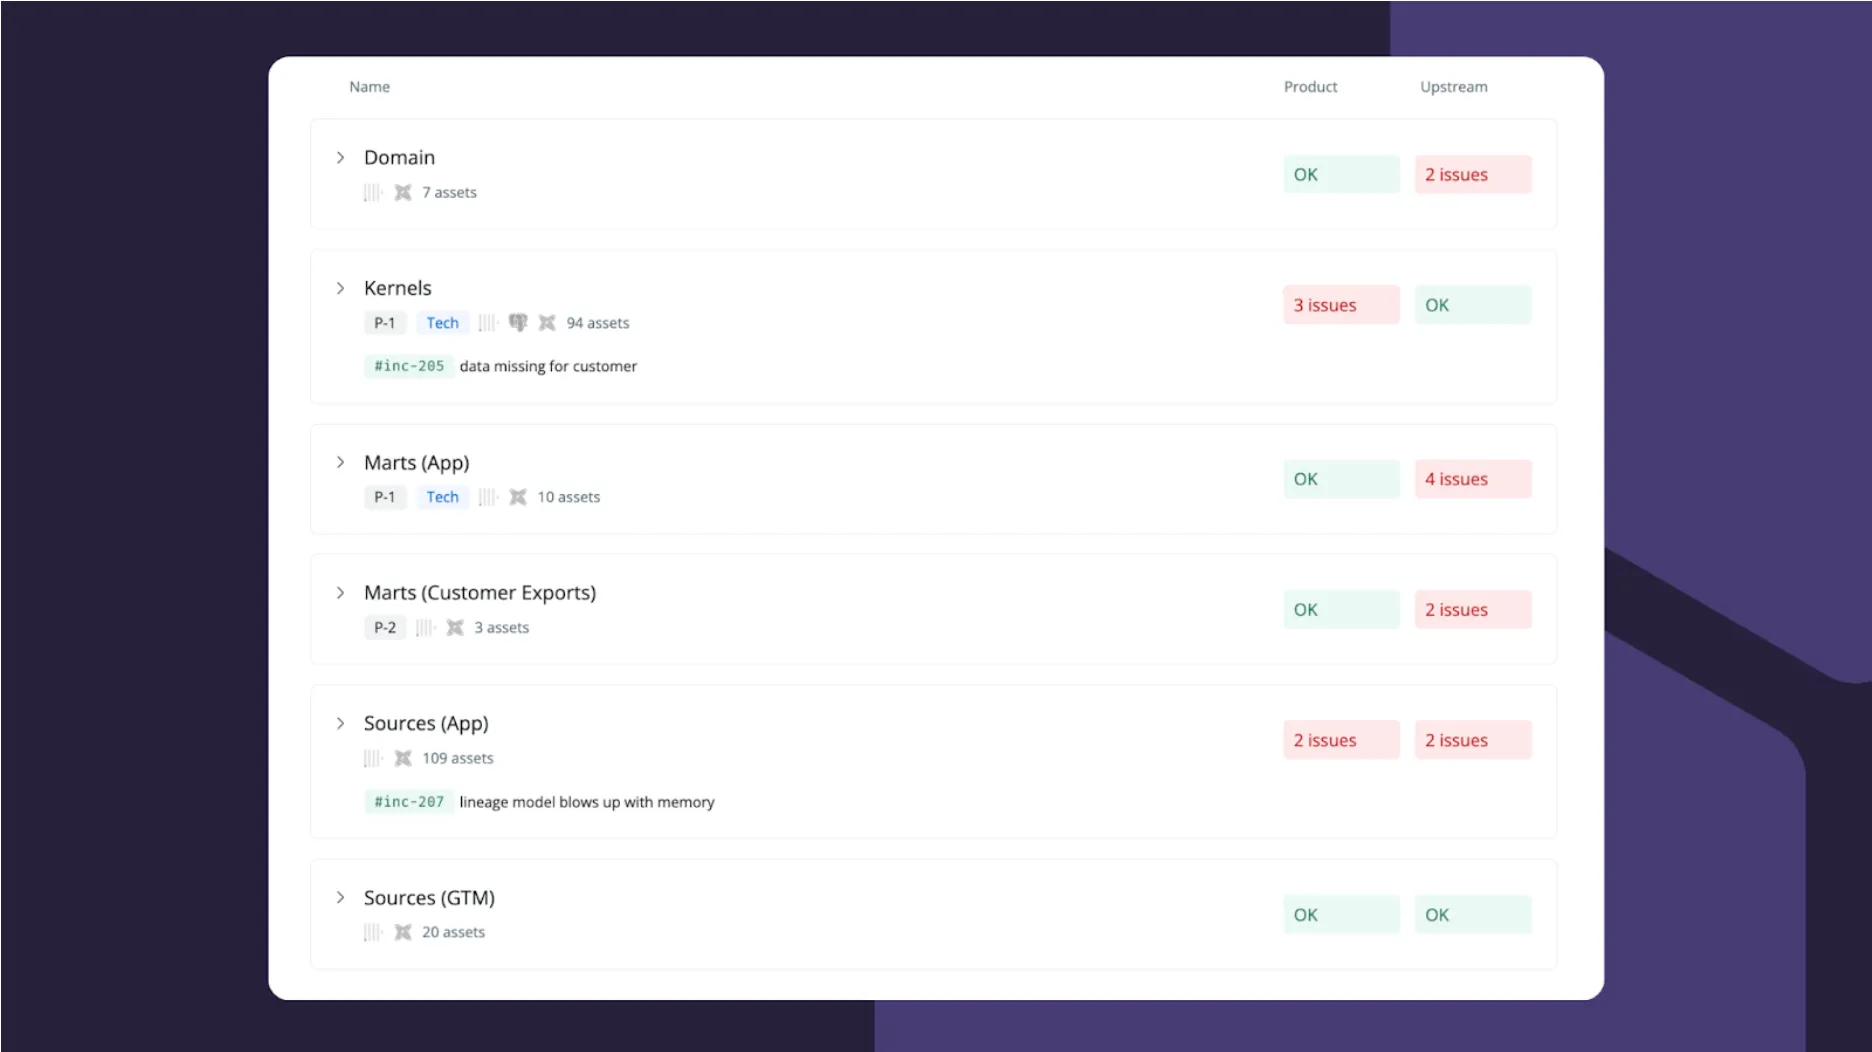
One of the advantages of using data products is that they provide a pane of glass for the most important parts of our stack and create a unified way to manage ownership. Everyone can open the Data Products page to see the health of assets they care about – whether you’re an engineer responsible for Kernel systems or a customer-facing engineer wanting to know about downtime for new customer integration. Open incidents are displayed alongside the data product for everyone to see.
Stage two: Triaging issues and declaring incidents
We use Slack as our main way of learning about issues through the #synq-ops-monitoring channel. Using the Data Products definitions, we’ve linked ownership with alerting so that only issues on production data assets are sent to the Slack channel.
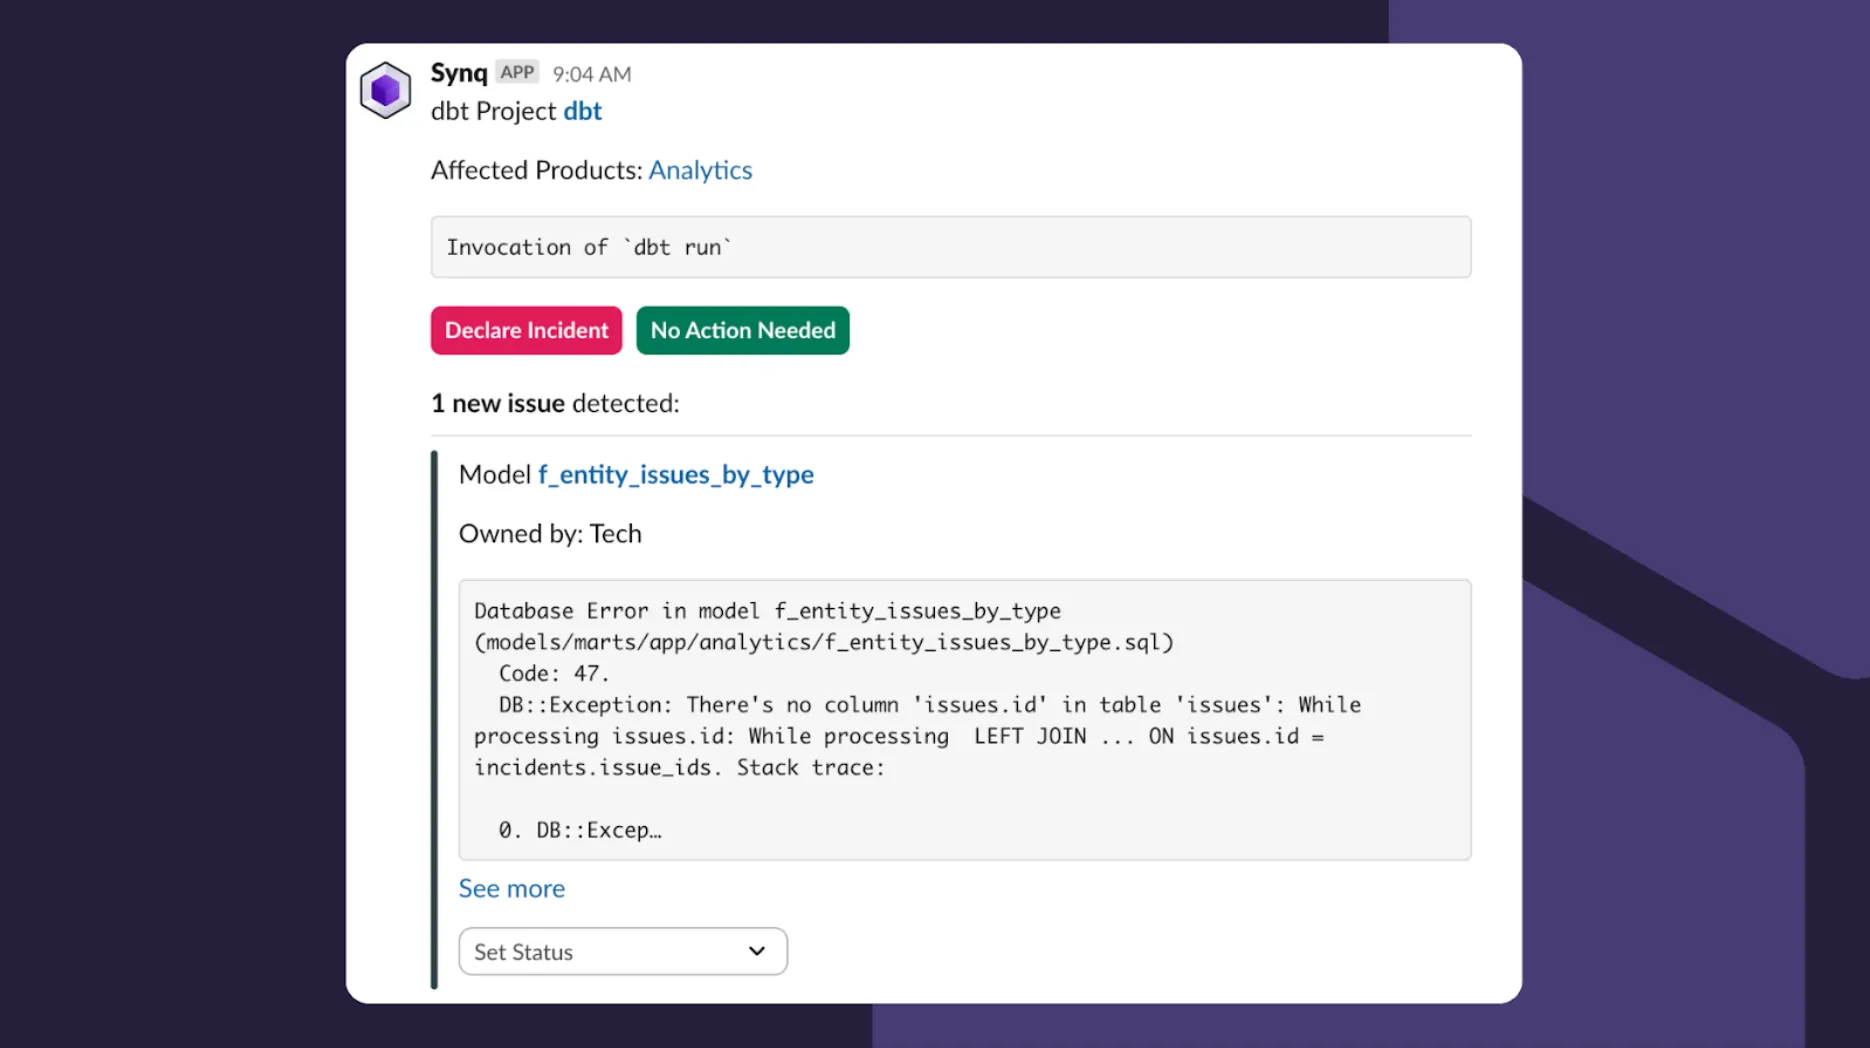
A typical workflow involves someone investigating an issue by setting the Status to Investigating, which indicates to the rest of the team that they’re looking into it. If the issue warrants an incident, we often declare it directly from Slack. We err on declaring too many rather than too few incidents, as incidents offer a unified way of working on an issue and a clear communication trail around it.
Admittedly, like many data teams, the #synq-ops-monitoring Slack channel can get busy with dozens of daily alerts. We’re okay with that, as we’d rather get too many alerts than miss an important customer issue, but we keep an eye on low signal-to-noise monitors and delete them in case they often trigger but don’t lead to any incidents.

Of the thousands of issues we flagged this year, 114 became incidents. There’s no exact right metric for what this should be, and it depends on your willingness to trade off missing potential issues versus having to spend more time reviewing potentially false positive alerts. Missed issues at SYNQ can mean we miss issues directly affecting customers, so we tolerate a high false-positive rate.
Our ClickHouse data warehouse provides data for each issue and the associated incidents. This allows us to see what detection mechanisms most often trigger incidents segmented by issue types and specific monitors—a good way to assess whether the signal-to-noise level is acceptable.

Stage three: Handling the incident
The Incident Overview screen is our one-stop-shop to understand everything we need to know about the incident – what tests or monitors triggered it, who are the affected owners and data products, and what, if any, activity or comments have other team members who’ve looked into the incident left behind.
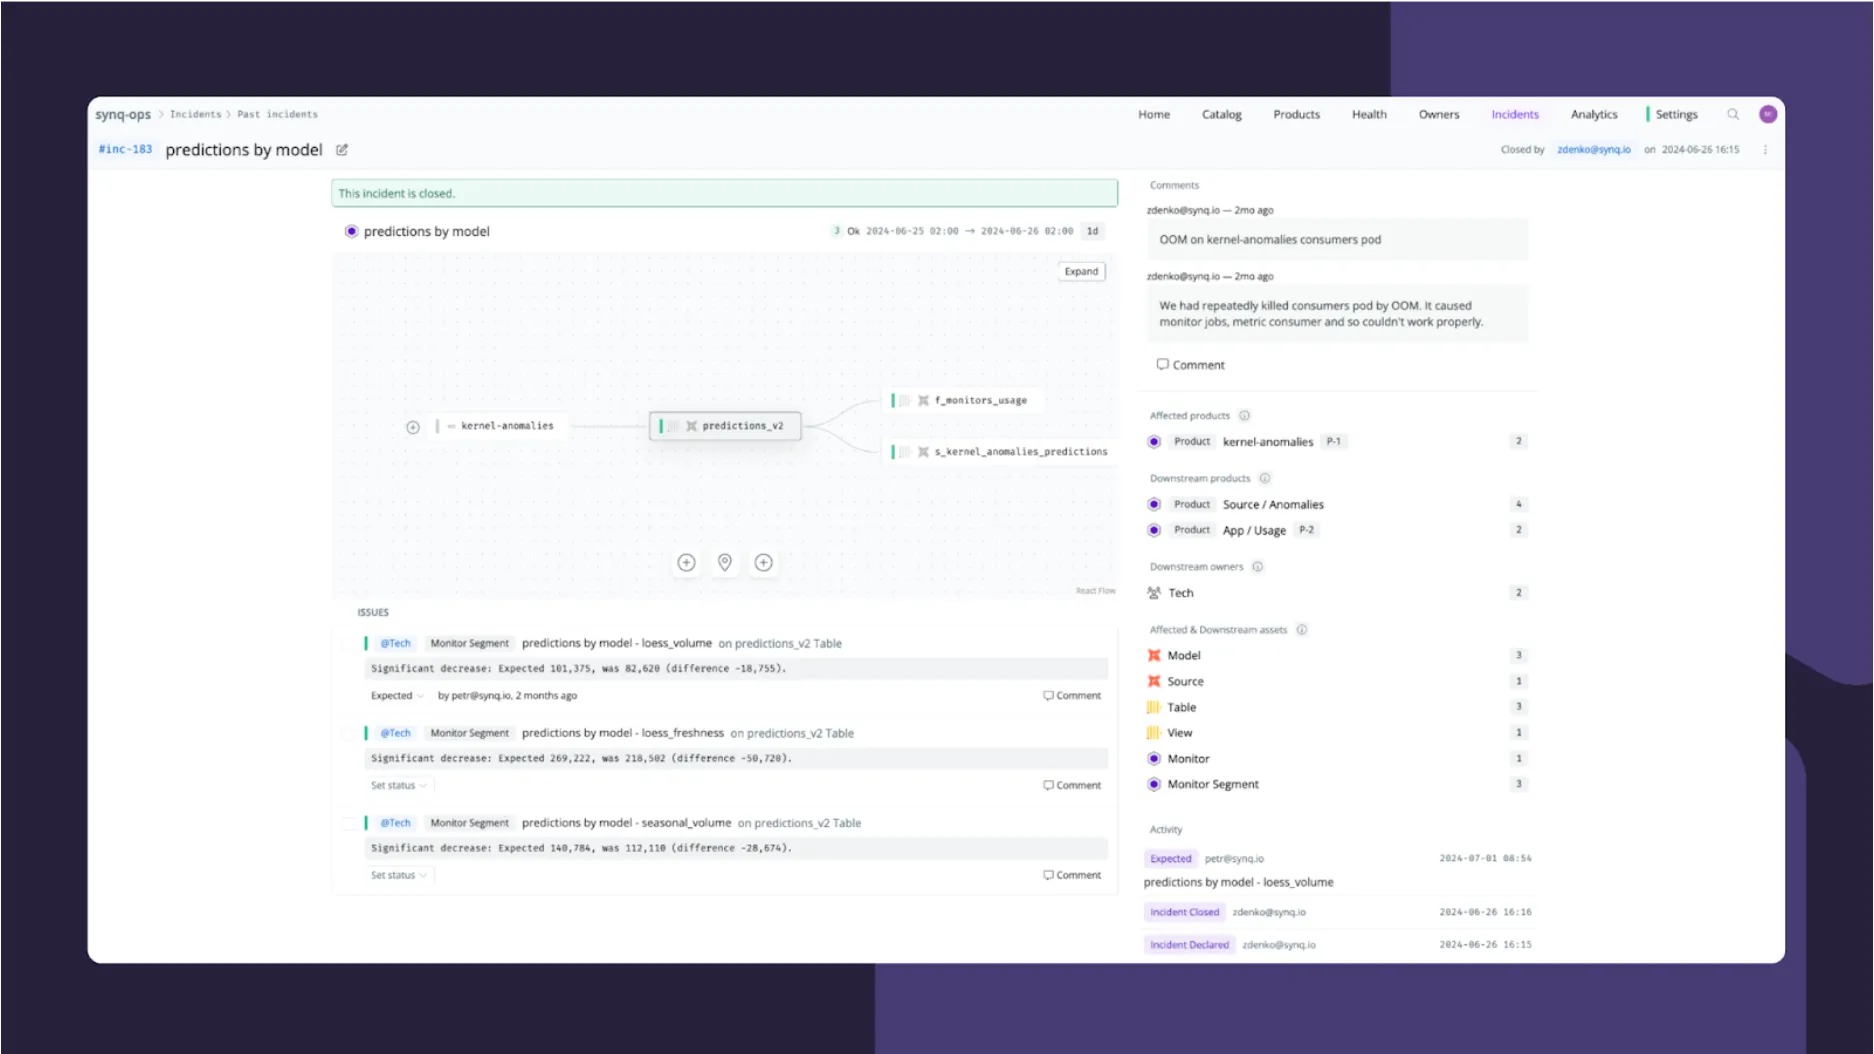
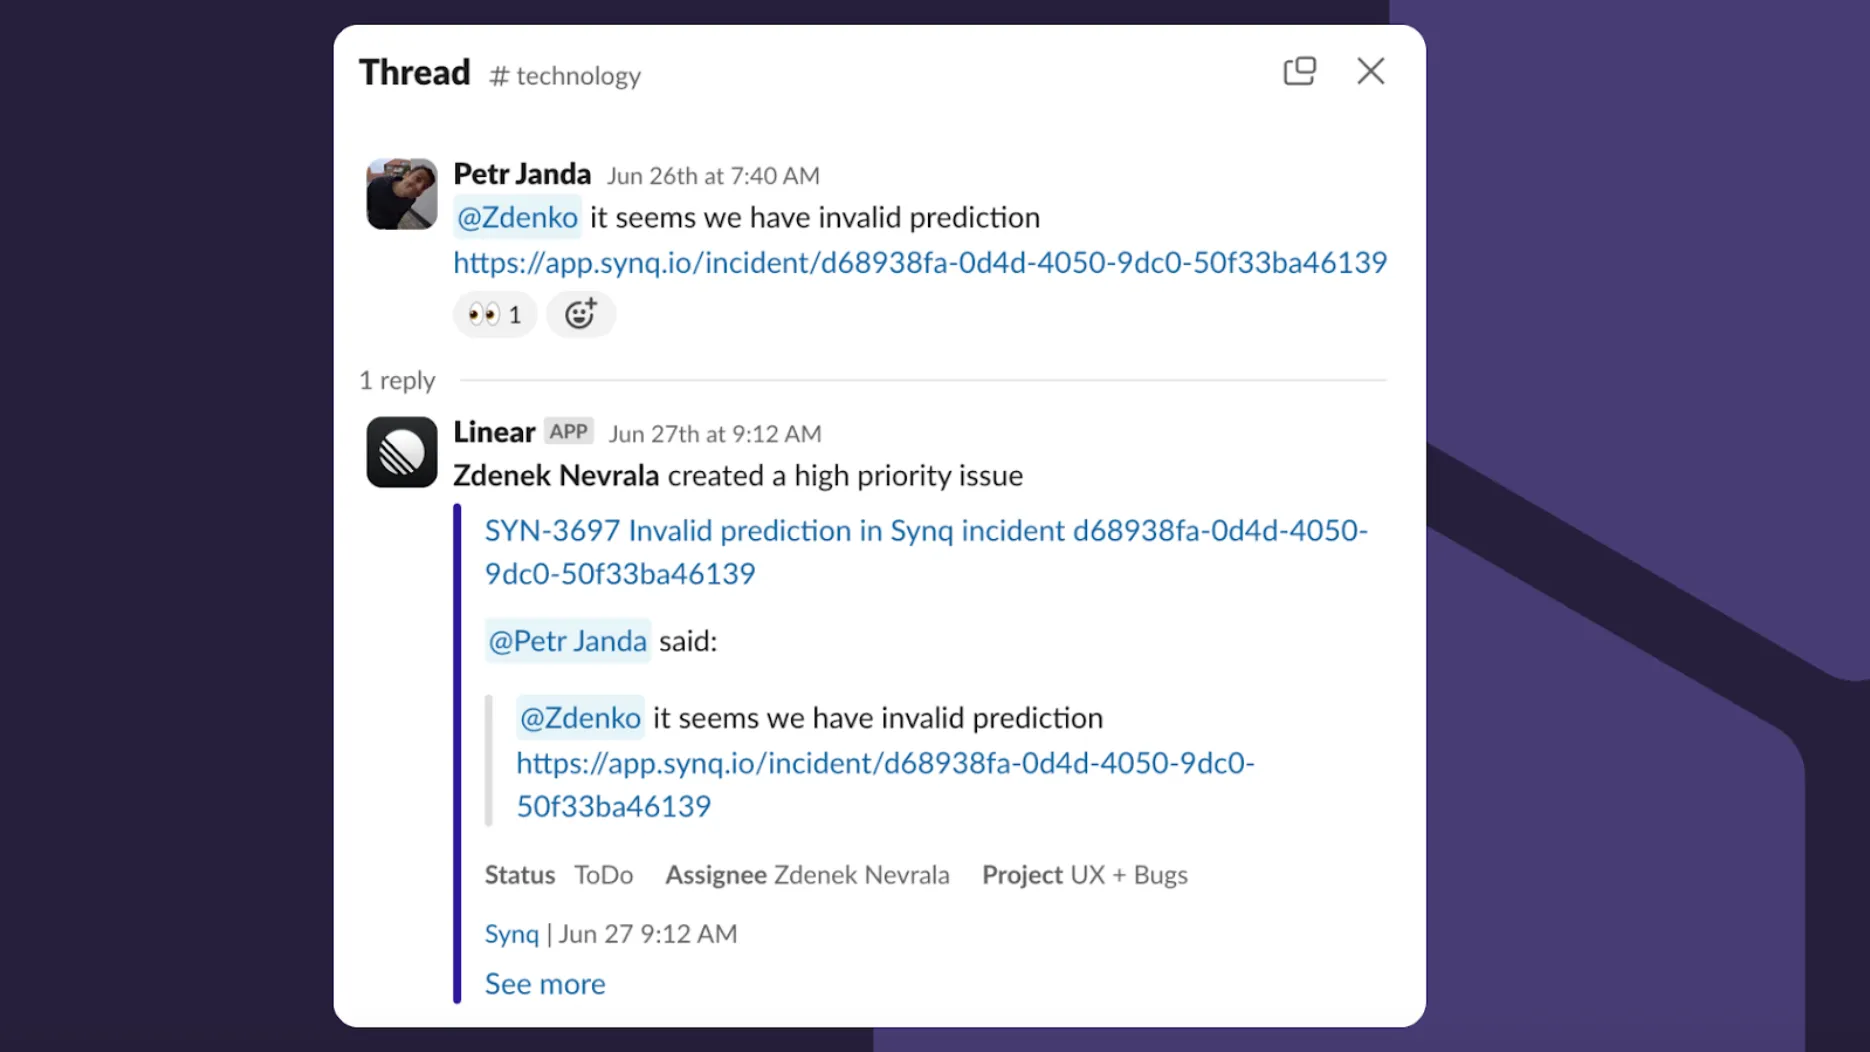
Admittedly, while we try to keep a high-level summary of the incident in the comments section in the incident, a lot of the back and forth that goes into solving the incident happens in Slack. We use Linear as our ticket management system and add incidents to Linear in cases where they should go onto the backlog.
Stage four: Post-incident analysis
One of the benefits of consistently declaring incidents is the ability to look back and assess whether incidents are one-offs or indicate something more systemic is going wrong. We’ve used this on several occasions to look back at a specific period in time when trying to explain an uptick or jump in a metric months after it happened.
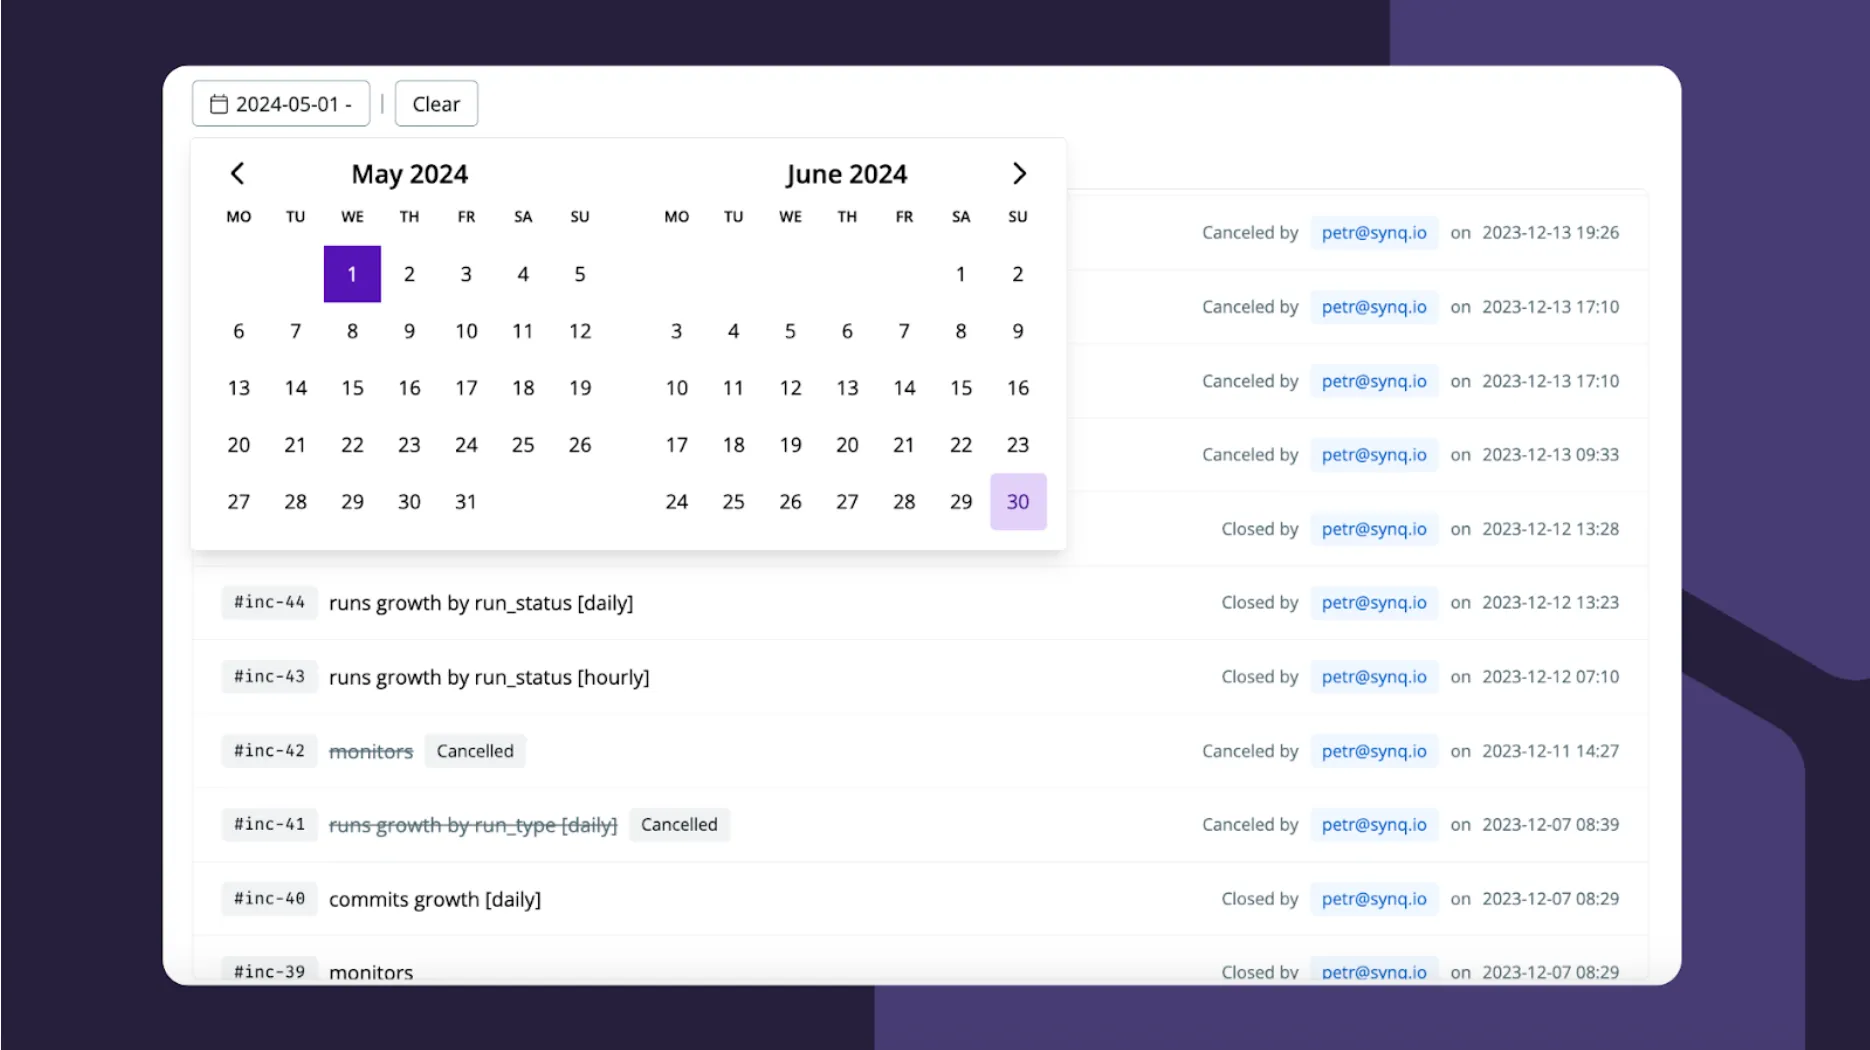
We use SYNQ analytics to examine past incidents and issues and understand uptime across key data quality dimensions such as completeness, reliability, and validity. In our case, the incident issues over time show that we’re roughly resolving and detecting the same number of issues that become incidents each week—a reflection of our trying to stay on top of incidents and keeping only a handful open at any given time.
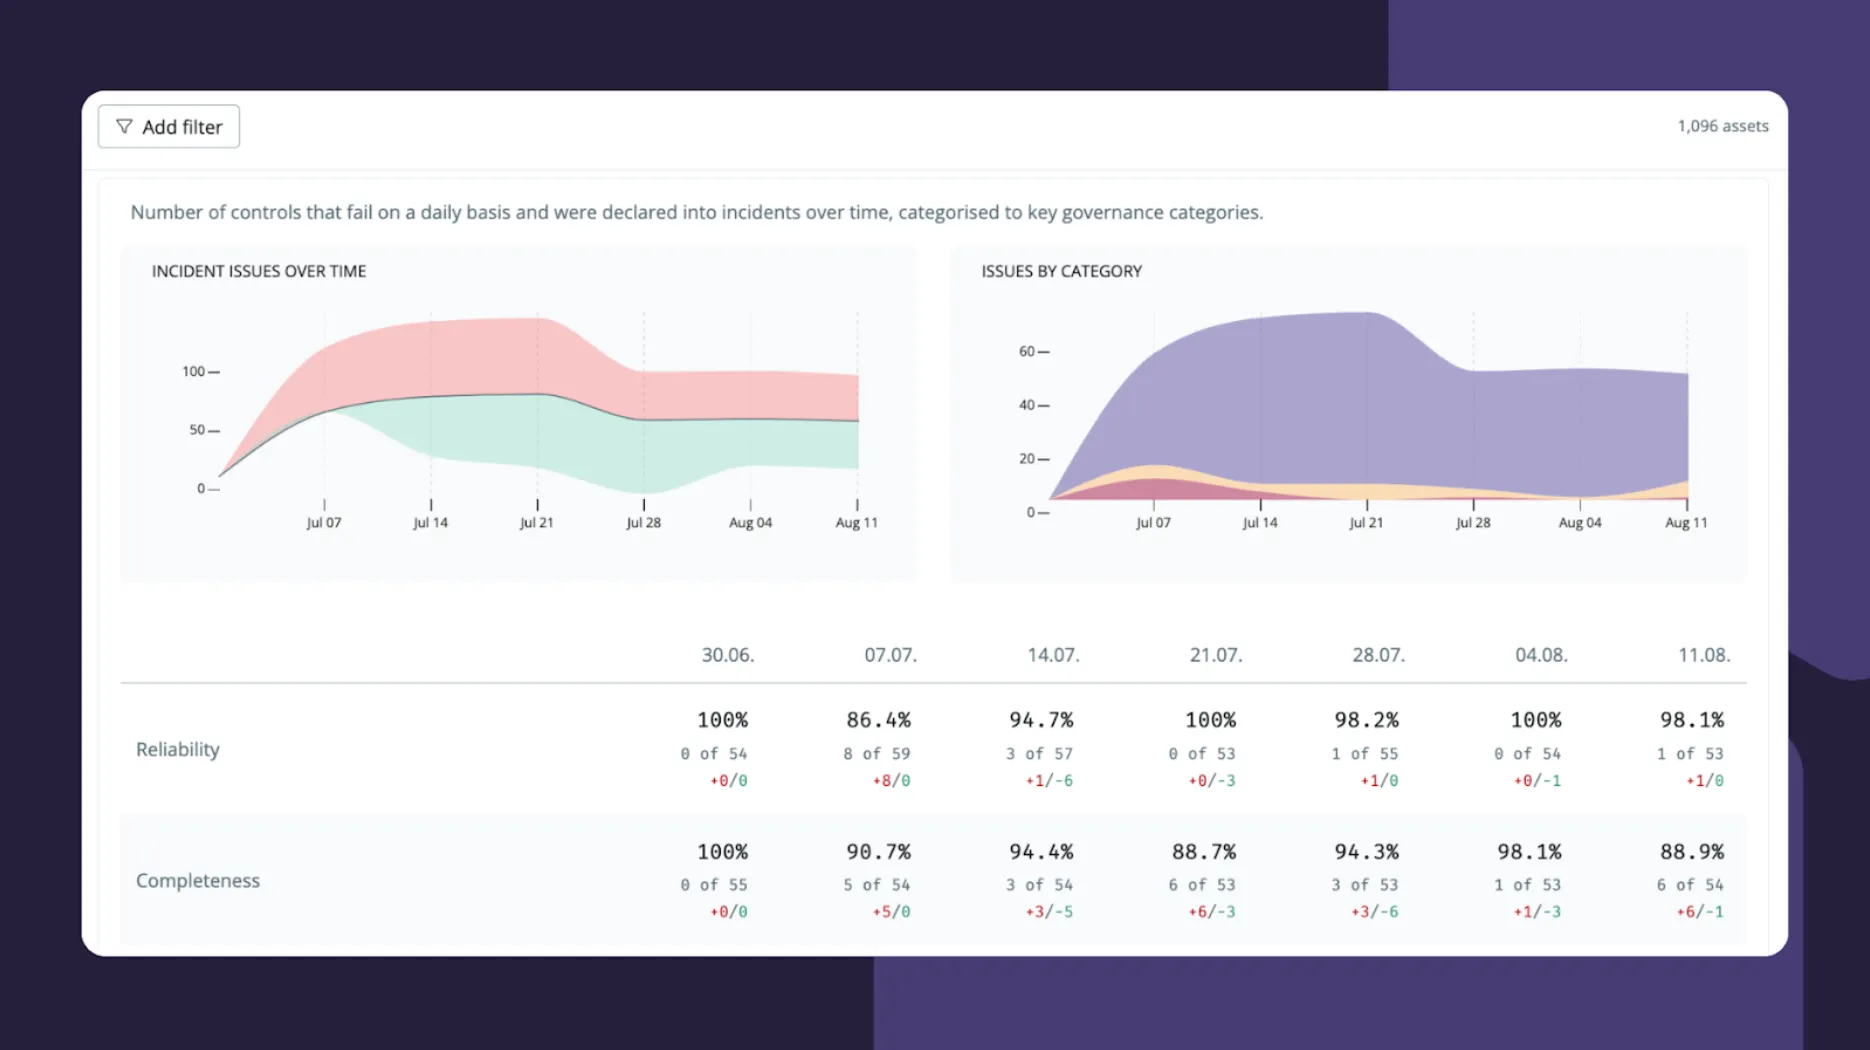
All incidents declared in SYNQ have an incident title describing the issue (e.g., “drop in metrics collected”). We can run these through a language model to detect common topics and how often they’re mentioned.
Here are the top 5 findings with the number of mentions included in brackets:
- Runs growth by workspace [daily] - This was the most frequently mentioned topic, referenced 18 times. It indicates the importance of tracking the daily growth in the number of runs across different workspaces.
- Runs growth by run_type [daily] - Mentioned 14 times. This reflects the tracking of daily growth in runs segmented by run type, highlighting the focus on analyzing performance based on specific run categories.
- # of predicted issues by workspace [hourly] - This point was mentioned 7 times. It emphasizes monitoring the number of issues predicted across different workspaces hourly, which is critical for real-time issue management.
- Empty model ID for predictions - Referenced 6 times, indicating a concern with predictions that are missing model IDs, which could lead to significant inaccuracies or gaps in prediction data.
- Send_alert_jobs growth by workspace [daily] - Also mentioned 6 times, this reflects the focus on monitoring the daily growth of alert jobs sent by workspace, essential for understanding alerting trends and potential issues in alert systems.
In our case, most issues mentioned by the incident title relate to Runs growth by workspace, the segment monitor that runs for each customer. It flags anomalies in the ingested data—something we’d rather be notified about one too many times than miss an issue.
Closing thoughts
As power users of data incidents, we understand what it means to be an organization that treats important issues as incidents in a team that owns business-critical data. We work with dozens of other data teams on this journey, and a common pattern is that one thing is the technical aspect of declaring incidents—but if the cultural buy-in is not there, the tech will only take you so far.
As you’ve seen in this article, the cultural element involves setting up the right monitors to learn about issues before they become incidents, notifying the right people, adjusting monitors based on the signal-to-noise ratio, and looking back to address systematic issues based on past incidents. Doing this first-hand on our data stack has given us valuable learnings we’re keen to share with customers.
As a next step to further integrate our incident management functionality with data teams’ workflows, we’re rolling out a wide set of integrations with tools like PagerDuty, Linear, and Jira. This will help data teams integrate into existing incident management processes that their engineering colleagues rely on and be a key ingredient for them to be trusted with owning more business-critical processes.
If you’d like to chat about our experience running incidents in a data team and how you can learn from it, get in touch!


