Monitors and UI updates
Monitor sensitivity, statuses, and UI improvements.
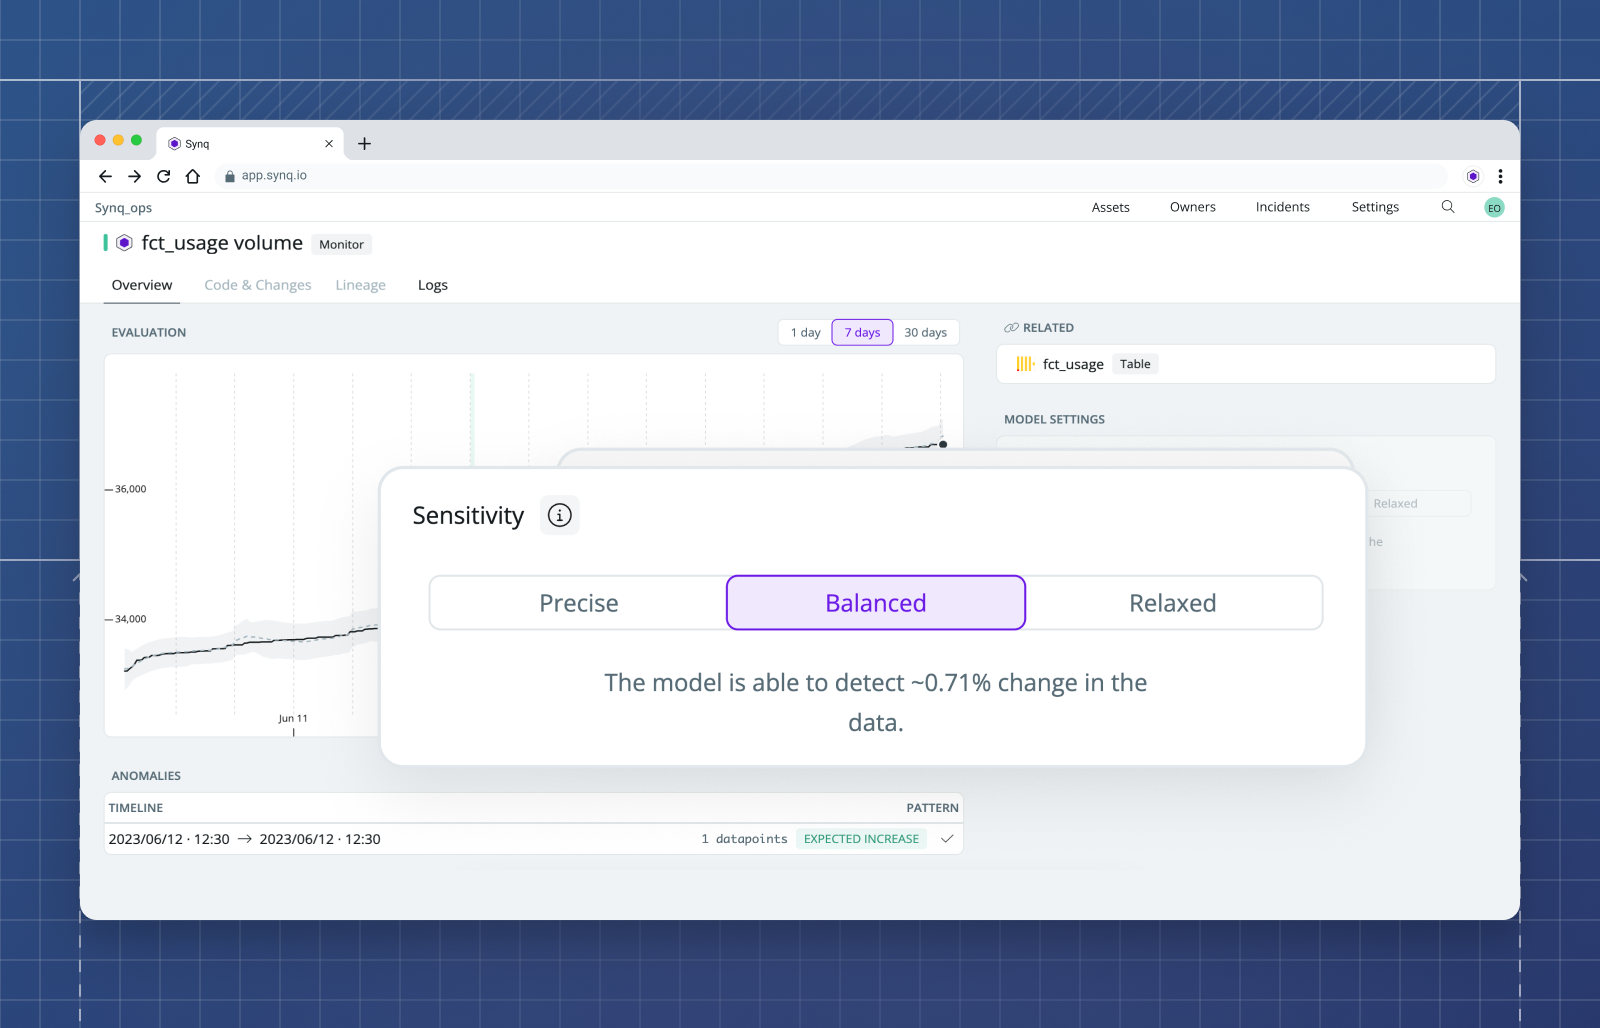
Adjust the sensitivity of monitors
Adjust self-learning monitors sensitivity to reflect your risk profile. Set precise monitors to detect deviations as slight as <1% from your normal traffic or a relaxed monitor that only detects significant changes, such as a large portion of your data missing.

See the status of monitors
Some models can take a few days to train to spot seasonal trends. While this happens, you can check their status and get an estimate of when it will be ready to go.

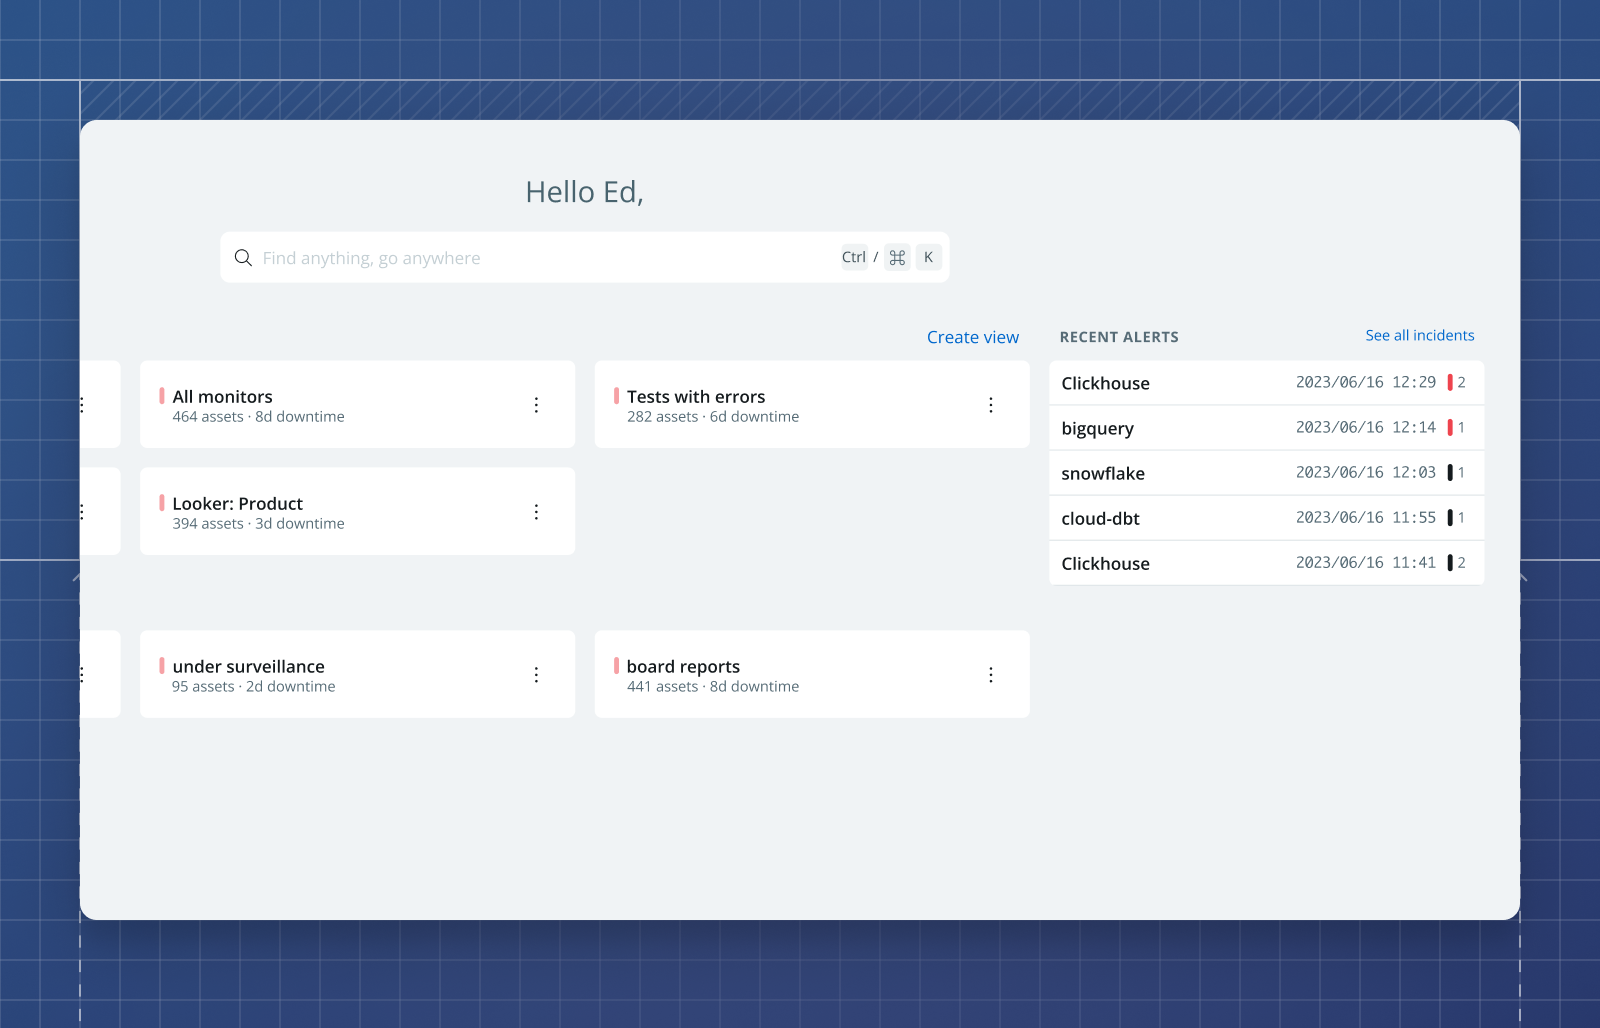
A refreshed look for views
Views now take up much less space in your home screen, so you can more quickly get to what you need. As always, you can quickly see how many assets each view has and the downtime of its longest failing asset. But now we display it in a single text row that’s more clear and space-efficient.

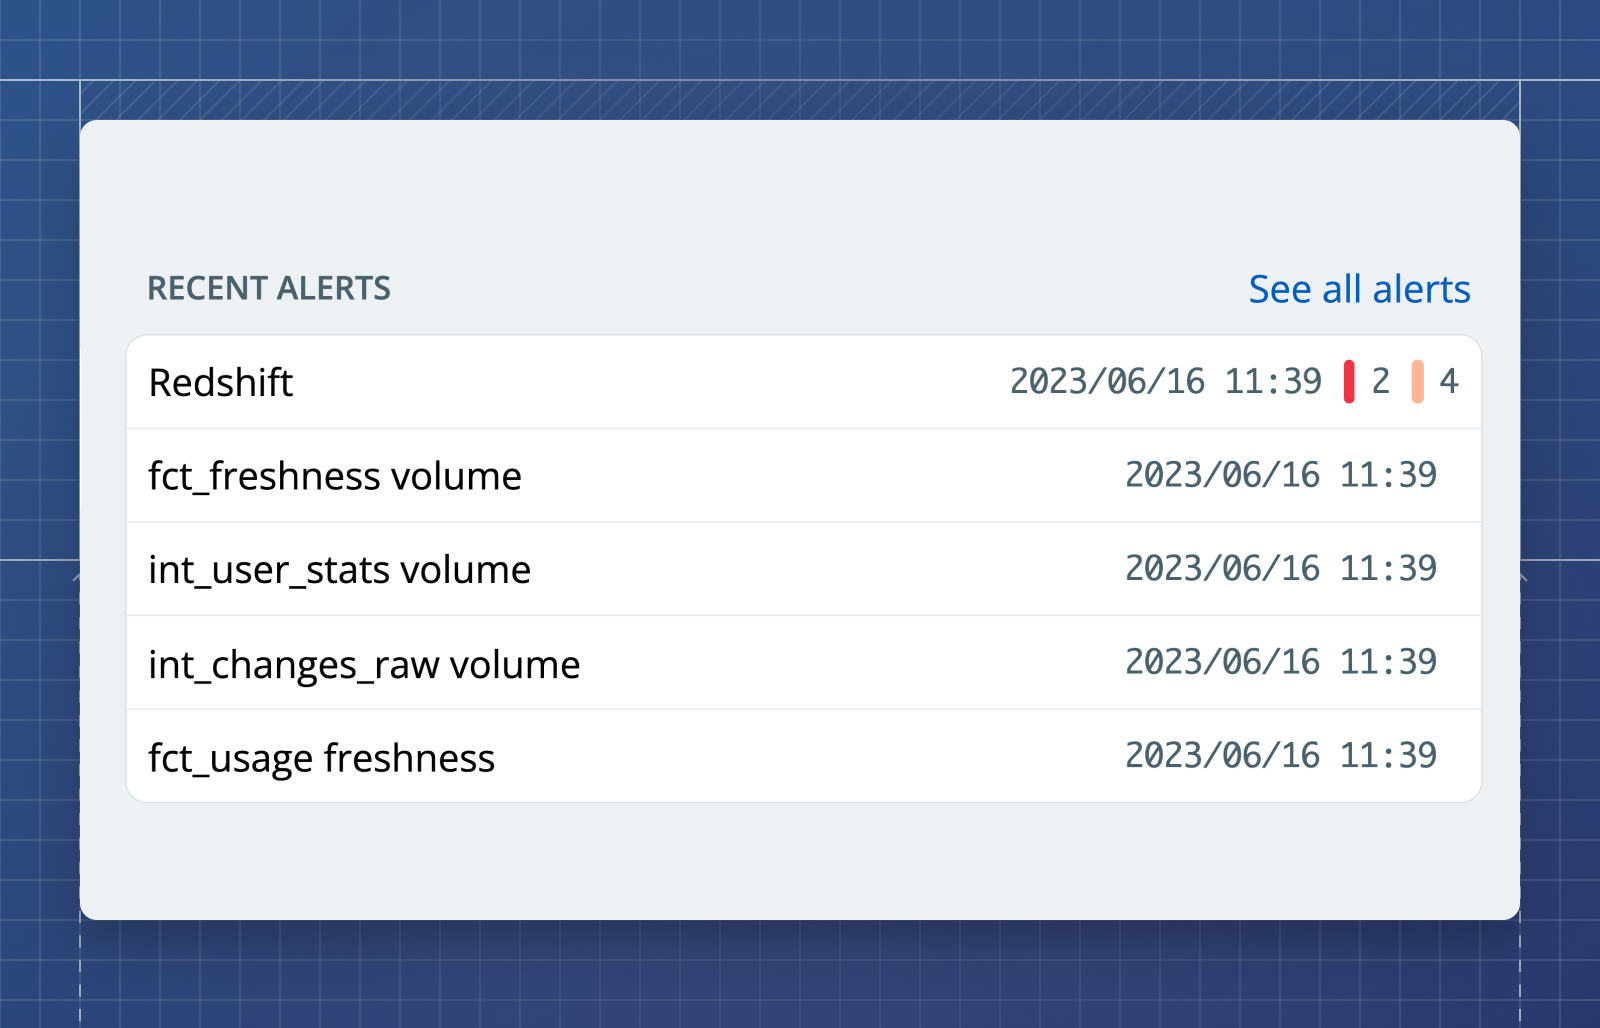
Improved recent alerts widget
We now group all alerts by job run. This eliminates duplication and lets you more quickly understand where errors came from.

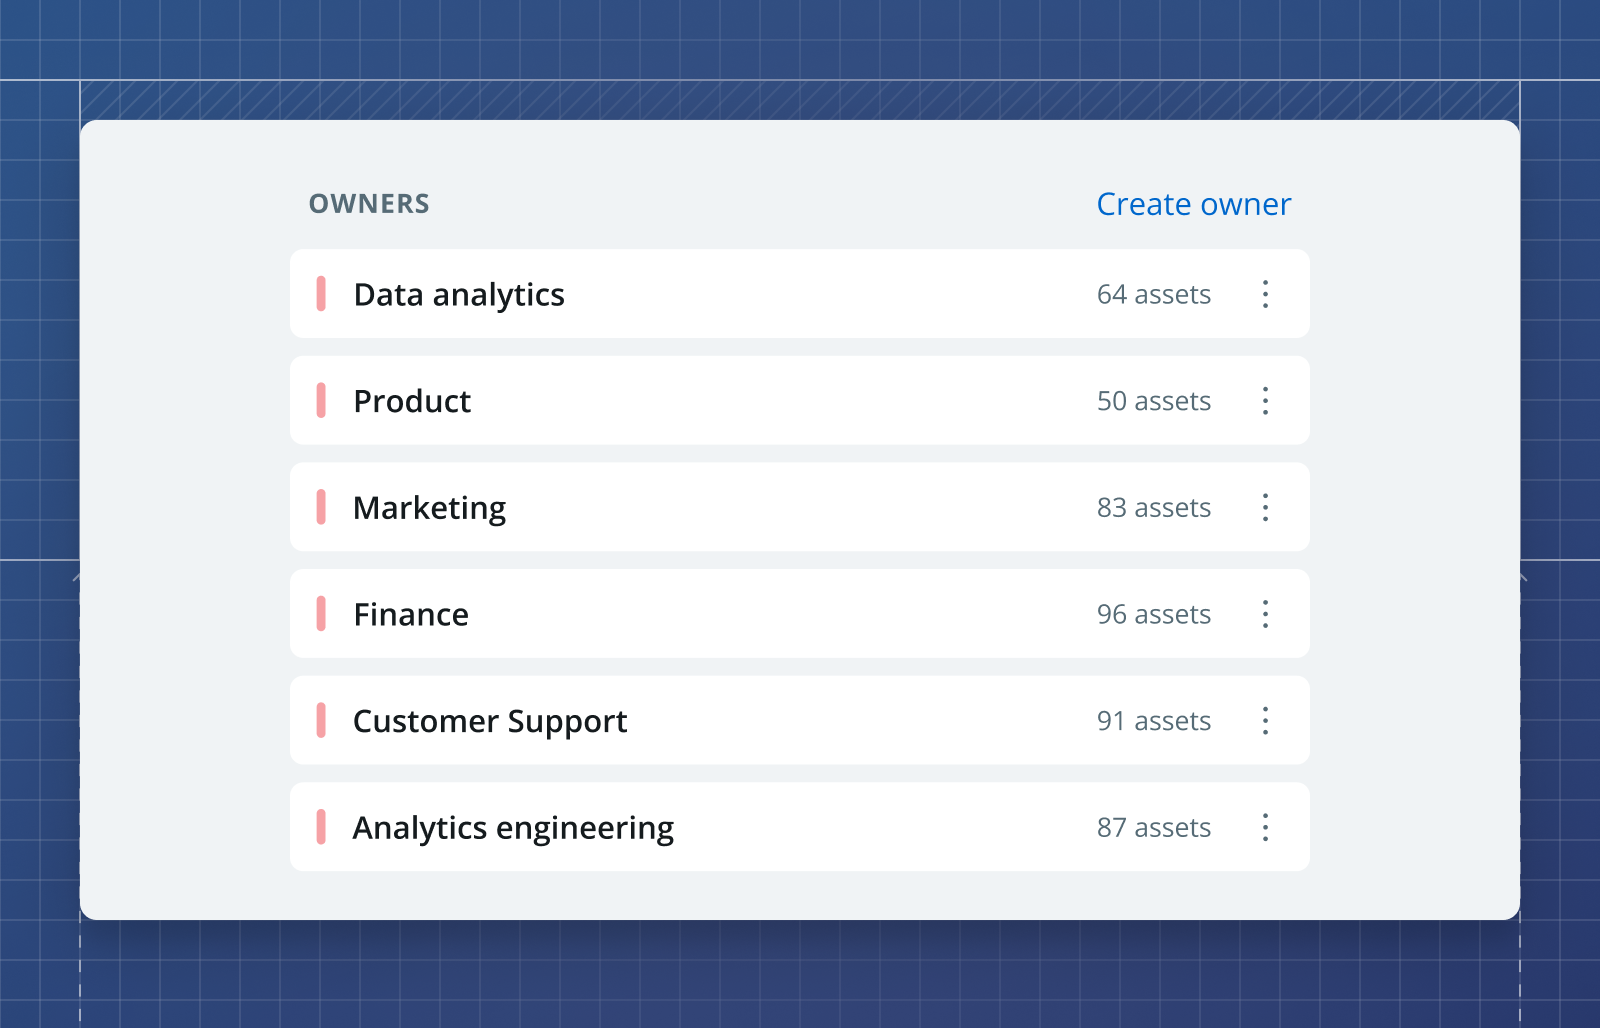
Better display of owners
Owners got some love as well. Now we display them in rows so they are easier to scan. On the left-hand side of each row, you can see the indicator that tells you if any of their assets has errors. On the right-hand side, you can see how many assets they own.

Build with data you can depend on
Join the data teams delivering business-critical impact with SYNQ.
