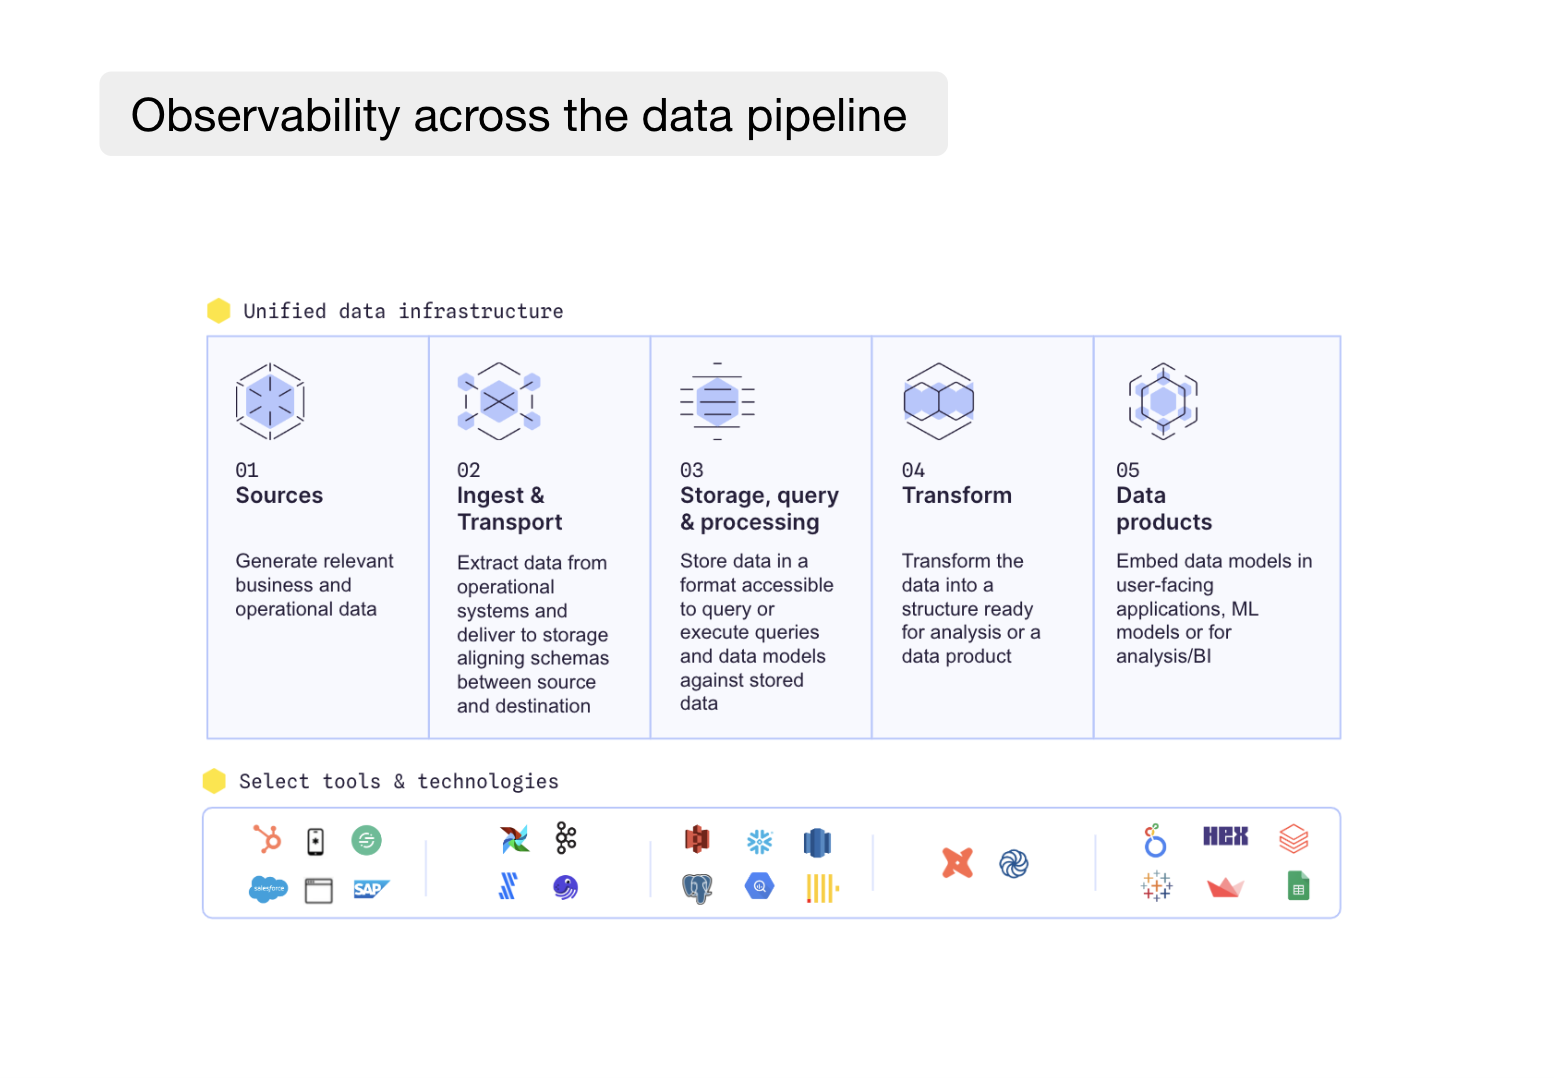
How data observability fits into the different stages in the data pipeline

In 2020, Andreessen Horowitz published Emerging Architectures for Modern Data Infrastructure. The article explores the core data processing systems and supporting tools and provides blueprints for key components and use cases in the modern stack: Business intelligence, machine learning systems, and multimodal data processing. Today, data teams increasingly need to be able to navigate all these systems and guarantee uptime throughout.
At Synq, our customers pull us across the stack to cover end-end observability, too.
“We want to detect issues as far upstream as possible, in near real-time, and display directly in the BI tool if there’s an issue impacting a dashboard – no matter where in the data value chain the issue originates” – logistics scaleup
We recently shared insights from speaking with 1,000 data teams, highlighting two trends that keep this topic at the top of our minds.
- The rise in business-critical data warehouse use cases is causing data teams to operate more like their software engineering colleagues.
- Data becomes exponentially more difficult with scale. Top data teams invest in ownership and regular cleanups and are intentional about what data is most important.
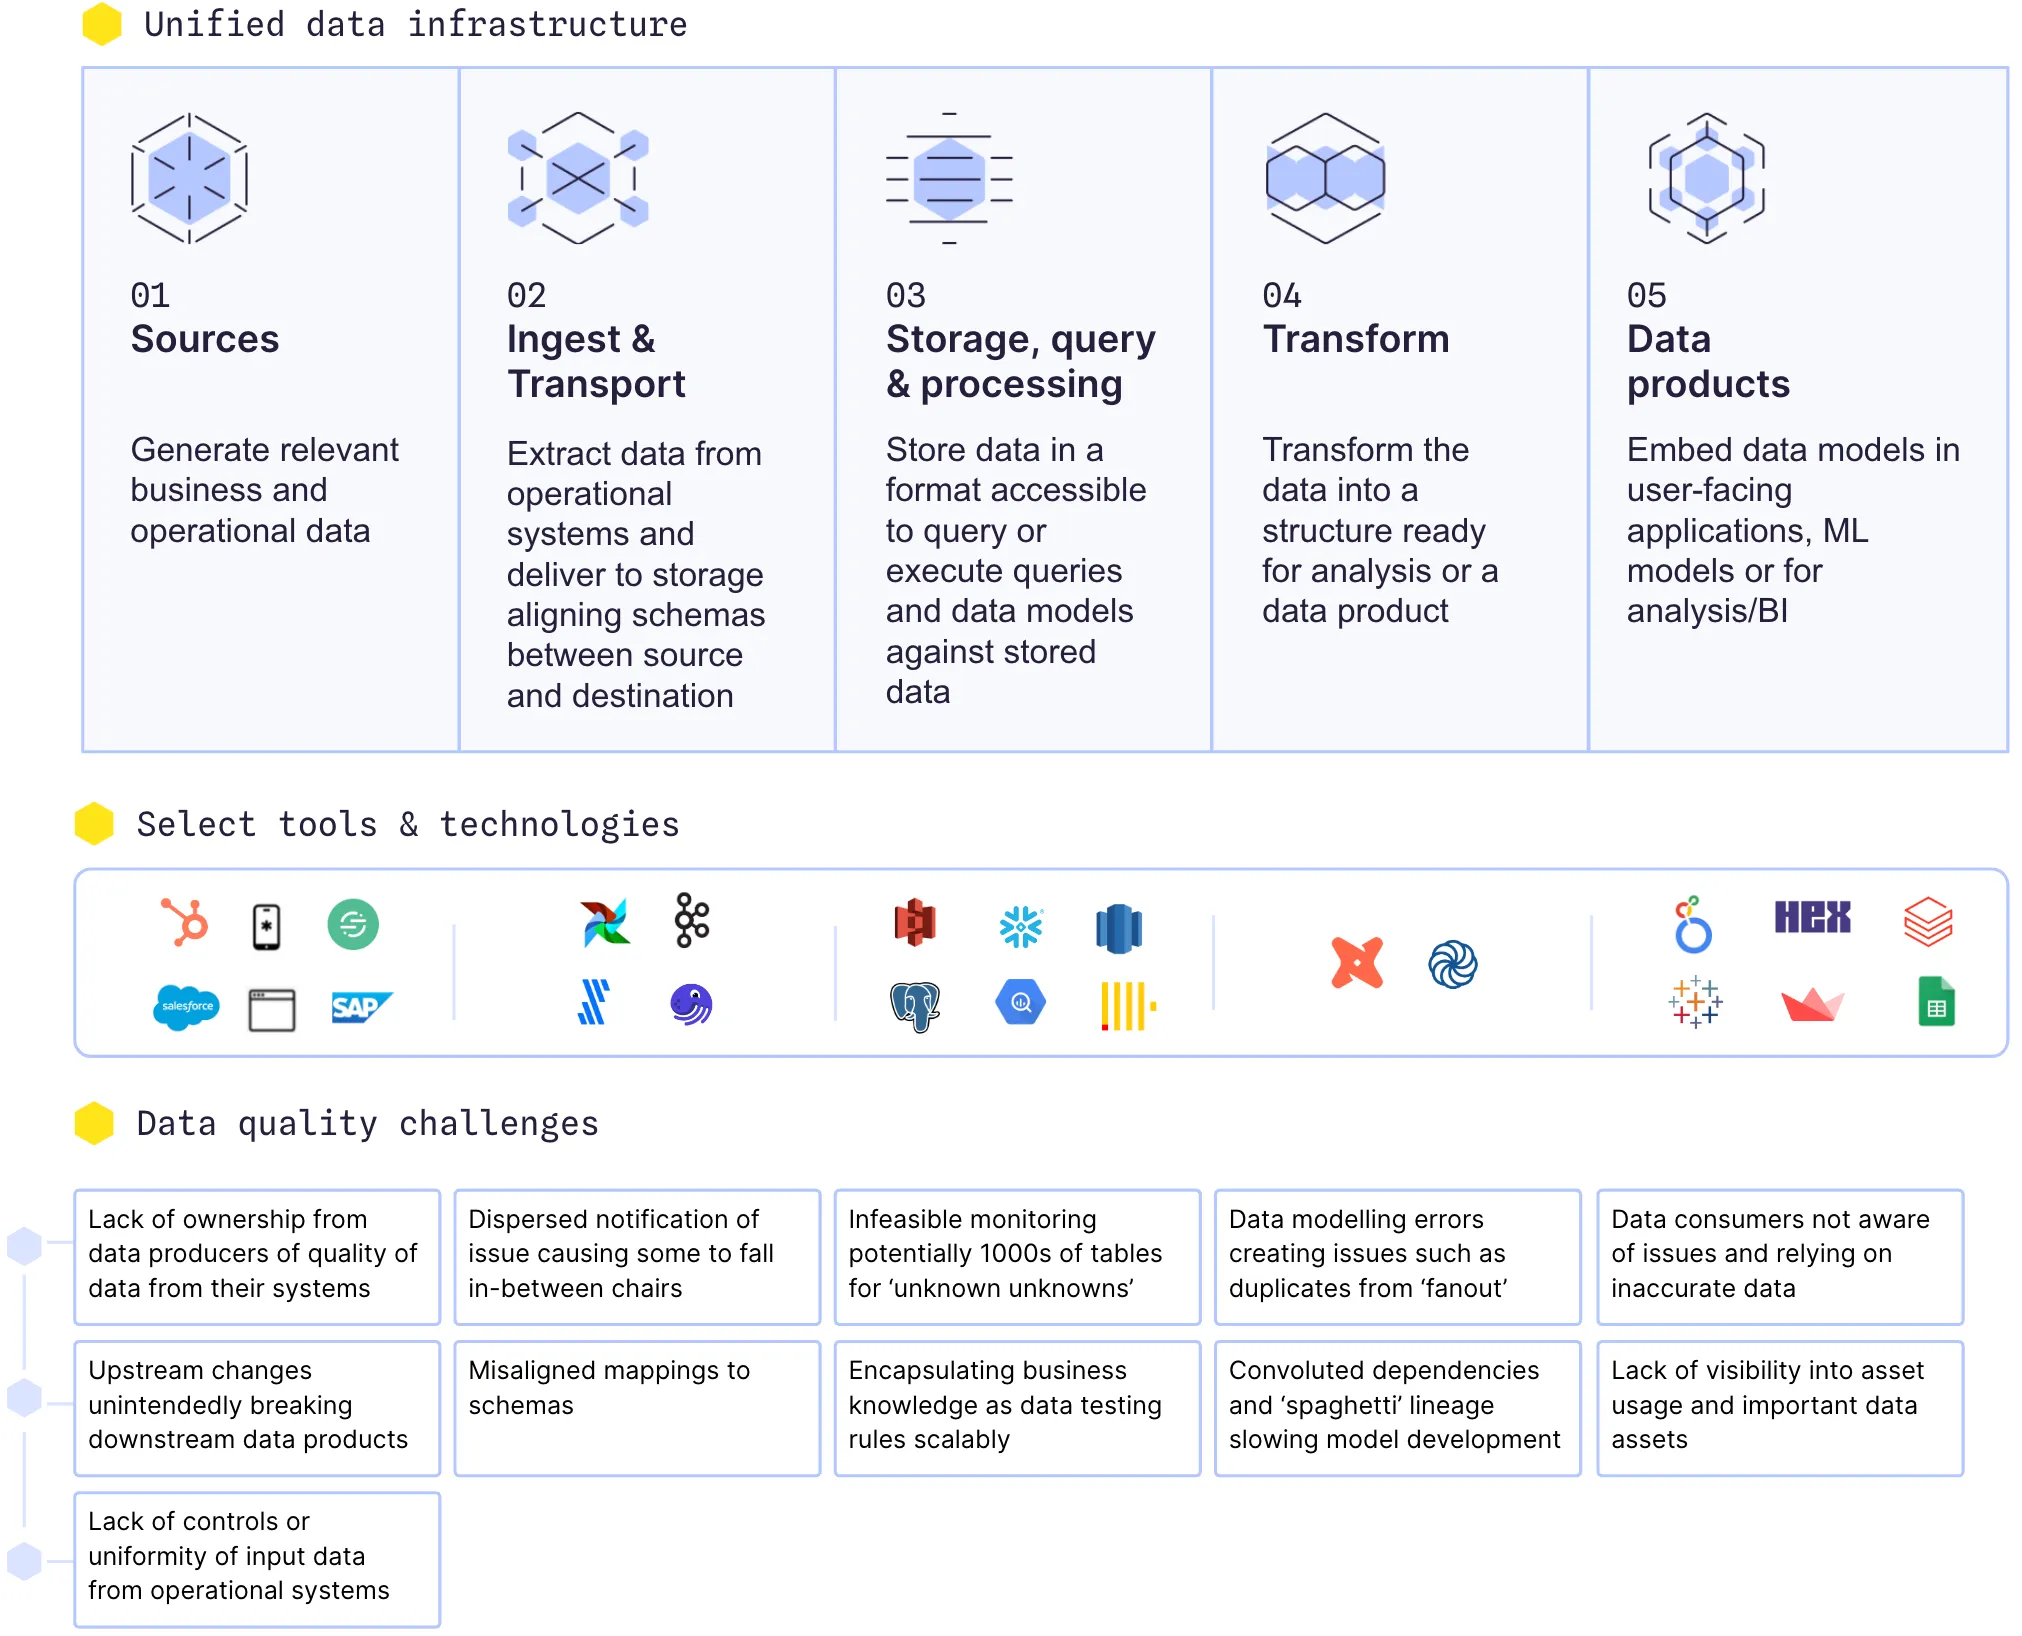
In this article, we’ll look into data observability tools’ role in different parts of the data pipeline and their limitations.
- Building guardrails at your sources and bringing accountability to upstream teams
- Ensuring that accurate data is ingested and transported to data lakes and the data warehouse
- Detecting issues in the storage and data warehouse layer amid a growing amount of tables
- Managing business logic in the transformation layer
- Delivering robust output and analysis
Sources
57% of analytics engineers surveyed in dbt’s state of analytics engineering survey found data quality to be their largest issue. In our work with data teams, over 80% of issues can be traced to issues directly related to upstream data, such as an engineer unknowingly renaming an important field or a SalesOps person creating duplicate entries for a customer. It doesn’t help that the number of 3rd party SaaS apps has exploded – the average number of SaaS apps a business uses reached 371 (Spendesk). This creates an increasing stream of systems where issues can originate and a scattered ownership map.
How data observability can help:
- Detect issues in near real-time on data ingested from sources to reduce time to detection by placing checks that are run down to minute-level intervals at data in storage (e.g., in Snowflake, BigQuery, or Postgres). A lineage map can help trace issues detected in a data lake or warehouse back to the source.
- Directly notifying owners of source systems of issues through a unified ownership model and with context that makes sense to them. For example, a non-technical alert explaining to a SalesOps person that a customer ID has a clash between SalesForce and Hubspot.
- Give software engineers visibility into the impact of making a change, such as renaming or changing the data type of a field, through end-end column-level lineage spanning the sources to BI tools.
- Adding guardrails or routing relevant alerts through data contracts specifying expectations for the data (e.g., the data type of a column), preventing inaccurate data from being transported to data lakes or the data warehouse. Specialized tools such as Gable are optimized for this.
What data observability won’t solve:
- Lack of ownership from upstream teams on poor data quality due to lack of rigor of input data in operational systems as a consequence of misaligned incentives or cultural challenges.
- Investments in guardrails in upstream systems to guarantee the consistency and accuracy of data, such as a dropdown in SalesForce to select customer vertical instead of a free-form text field, which is prone to errors.
Ingestion & transport
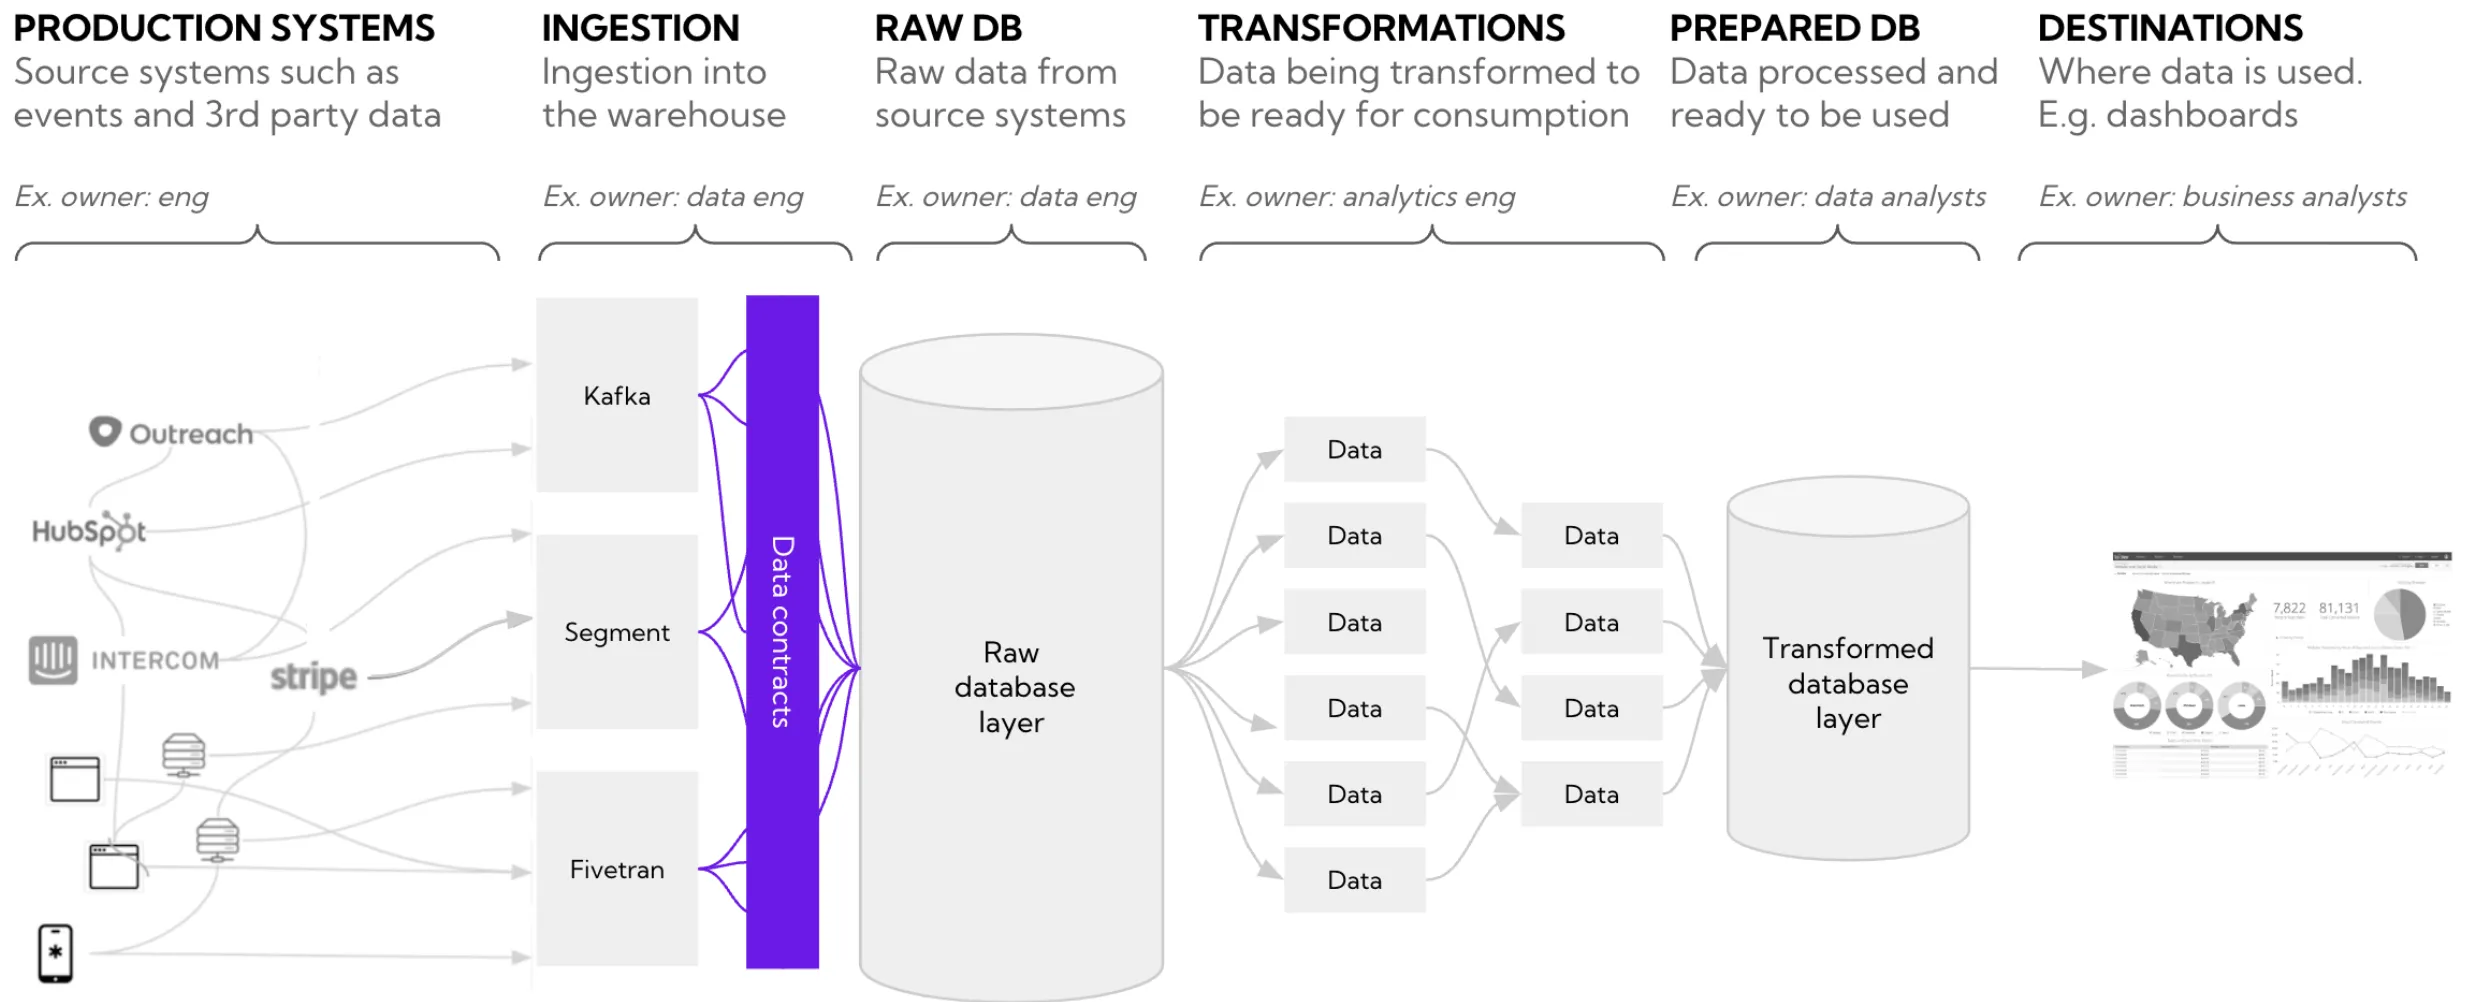
A typical data stack uses one or all of the following for ingesting data from source systems: Events from products, logs, or application usage sent to a data lake (e.g., Kafka). Data from 3rd party apps loaded at a prespecified schedule (e.g., Fivetran). An orchestration tool to manage bespoke workflows (e.g., Airflow). Ingestion and transport are key steps in the data pipeline, as once data has been ingested from source systems into the data lake or data warehouse, it can be difficult to clean up retrospectively and, in some cases, may be impossible to replicate corrupted data.
How data observability can help:
- Unify the issue notifications so that all issues arrive in the same platform (e.g., Slack) and with relevant metadata to prioritize and escalate them.
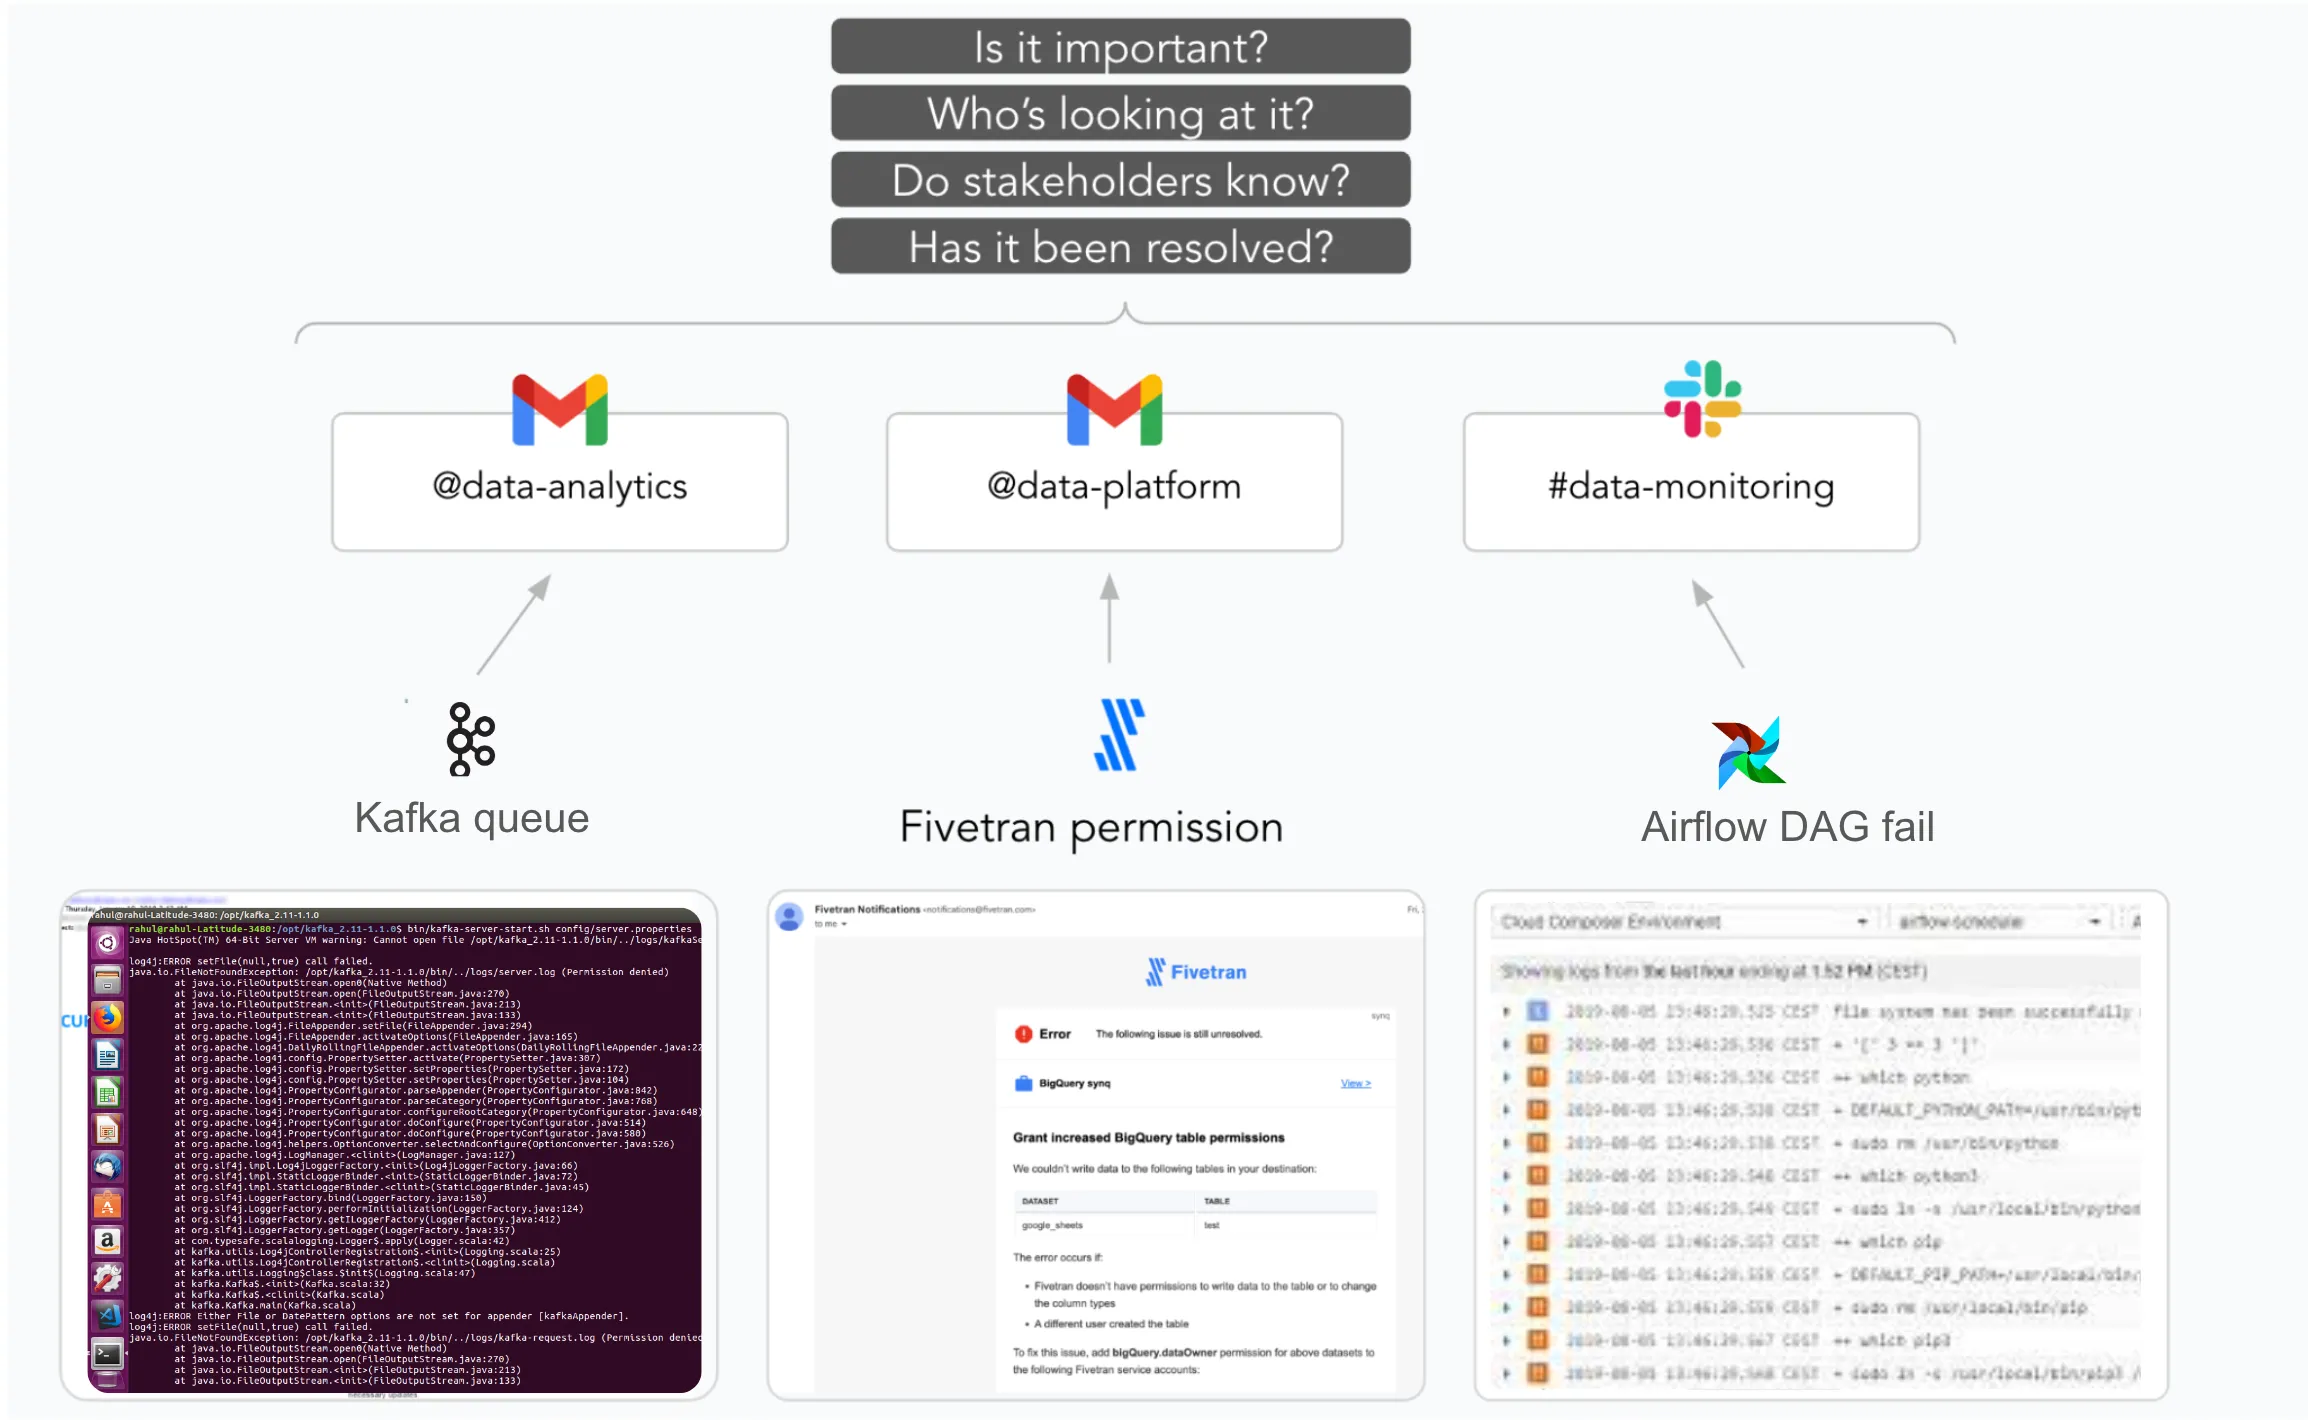
- Detect if an ingest, such as a Fivetran connector, is stale or running at a misaligned schedule through automated freshness monitors on tables in the data warehouse placed on Fivetran landing tables.
- End-end lineage to reduce the time to resolution by connecting the dots, helping point data analysts or analytics engineers to the relevant upstream connectors after a data quality issue has been detected downstream.
What data observability won’t solve:
- Faulty mappings where data is ingested into the wrong schema or columns without creating downstream issues that may be harder to trace.
- Misaligned business schedules where an Airflow DAG or Fivetran sync is scheduled to run when the underlying data has not been finalized yet. For example, data from operational systems may only be available at 10 am, or a dbt transformation pipeline may run at 9 am, requiring upstream syncs to have executed before that.
Storage + Querying
Data at rest in a data lake (e.g., S3) or a data warehouse (e.g., Snowflake) is the layer where most data consumers use the data—whether through a BI tool reading from a table, a machine learning model using a prepared feature store, or ad hoc analysis in a notebook. A key challenge is the scale of modern data setups, with many teams exceeding thousands of tables (read more about the struggles scaling data teams face).
How data observability can help:
- Detect semantic and data quality issues proactively, such as an ID field that is not unique or a numeric value falling outside an expected range. Generic and business-specific tests can help build guardrails around your data using the expectations you have. Tools such as dbt or Great Expectations are great starting points for these.
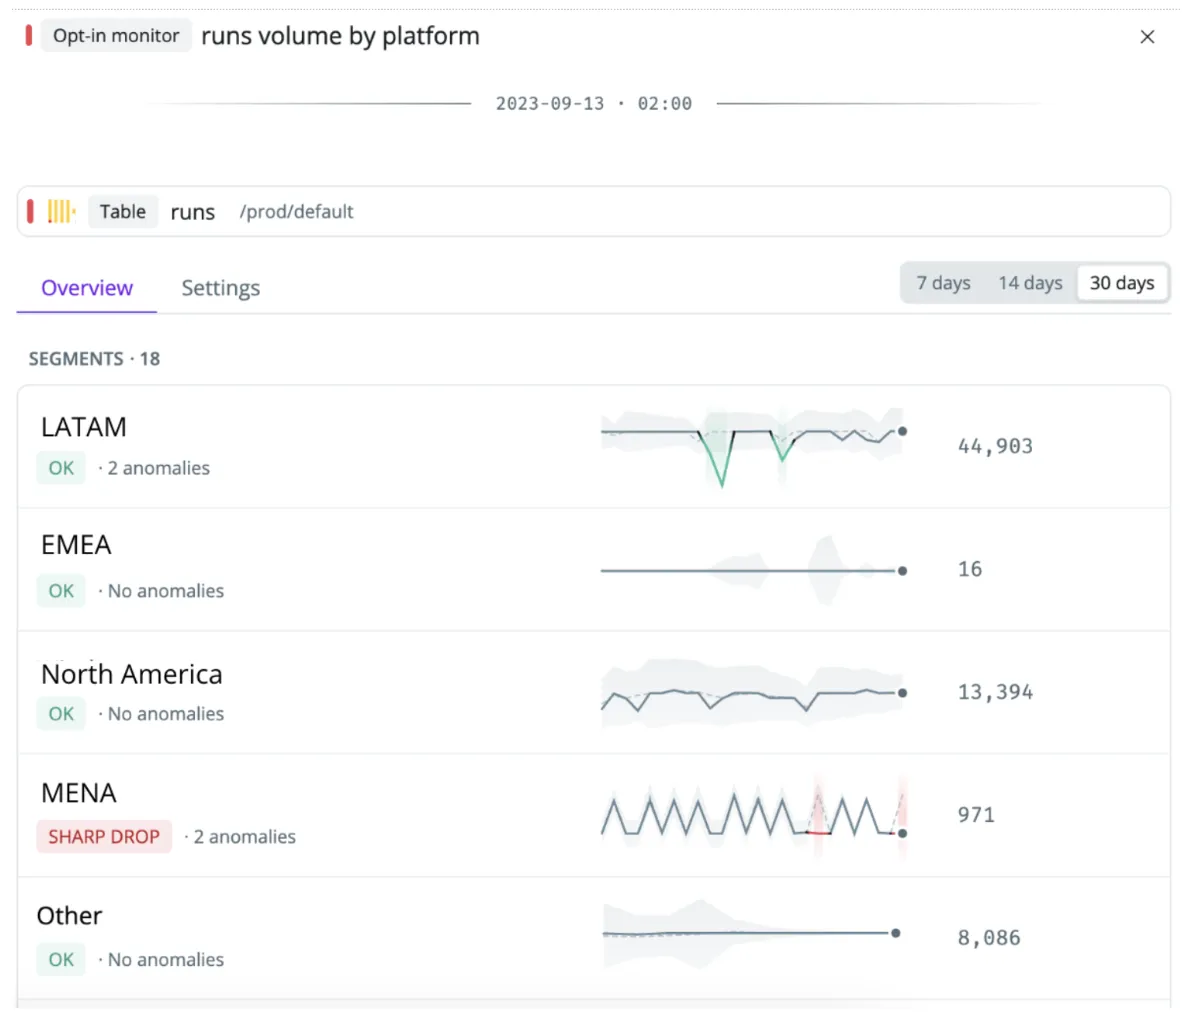
- Detect ‘unknown unknowns’ by deploying anomaly monitors across hundreds of tables, such as self-learning row count or freshness monitors. This is particularly helpful if you don’t know the exact threshold for a data quality test, are unaware of, or have failed to anticipate a check being needed.
- Rich issue detection is costly to build in-house, for example, by detecting inconsistencies in a numeric column broken down by a segment accounting for seasonality.
What data observability won’t solve:
- Data stored in the data warehouse is only as good as the sources it relies on. If mappings are incorrect or upstream operational systems have not been properly set up, these issues should be fixed further up in the chain in collaboration with data producers.
Transformation
Data transformation is the process of transforming data from raw tables into data models that are ready to use as data products. Historically, there have been many variations of how to do this. Today, most teams converge on these approaches – using application layers such as LookML, running stored procedures in Airflow often enhanced with internal tooling, or using a dedicated data modeling tool such as dbt or SQLMesh. Most of these tools have built-in ways of assessing and checking the quality, putting checks in place to prevent merging code if a test fails through CI checks. A few tools are becoming increasingly popular, with dbt being used by more than 30,000 companies.
How data observability can help:
- Enrich your CI/CD to prevent issues from happening. For example, the Synq API can help you enrich your CI checks by showing if any critical downstream assets are impacted by a code change, indicating that you should have increased scrutiny before merging it.
- Detect modeling errors in near real-time. While existing data quality checks in tools such as dbt may help you catch if a logical condition like a duplicate ID is breached, it won’t detect ‘unknowns unknowns’ such as fanouts creating an unexpected spike in the number of rows in a table.
- Simplify the root cause analysis of issues by connecting the dots across the stack. For example, by highlighting in a Slack alert if there was a recent code change before a data issue or the most common segment to fail a data quality test.
What data observability won’t solve:
- Business logic tests that require domain expertise, such as a metric that should strictly fall within a specific range.
- Convoluted business logic and interdependencies as a result of inefficient data modeling practices.
Analysis and output
The rest of the upstream data value stream is pointless without an output used somewhere in the business. The traditional output of data teams is BI dashboards and analysis. However, the data warehouse is increasingly used for operational use cases, such as predicting the dispatching of vehicles and operators in real time. In situations like this, an issue may go from annoying to costing the company millions weekly if left unaddressed.
Outputs, where there’s no human in the loop, are especially important to monitor, as issues can otherwise go undetected for a long time.
Consider a machine learning system relying on dozens of features to decide if a new customer is too risky to sign up for a scaling fintech – arguably one of the company’s most important decisions. The model’s output may have a human in the loop, but it’s near impossible to use intuition to spot if an upstream data issue is causing a feature to have missing values, skewing the predictions. Worse, these issues can persist for months or even years without being caught.
How data observability can help:
- Notifying downstream users directly of issues by, e.g., displaying a badge directly in the BI tool that an ongoing incident impacts a key KPI or routing a Slack alert to them indicating that one of their reports is impacted.
- Incident management and impact assessment workflows to assess which analysis, dashboards, and data products are impacted to expedite the resolution of business-critical issues detected further upstream.
What data observability won’t solve:
- Giving you the full visibility of what’s important. If a report is only used by two people but is required for regulators every quarter, it’s important. You may be the only one to know.
- The usefulness of data products. Poorly built dashboards and faulty logic at the BI layer won’t be fixed by a data observability tool but rather by deeply understanding your users.
Looking ahead
We’re still in the early days of the adoption curve for observability tools in data teams, and for most teams bringing in such a tool, it will be the first time they do it. As such, the challenge is as much a cultural as a technical one. Data teams are already bought into the idea that data quality is important, but executives must get on board. Whether it’s the COO taking ownership of the input data from operational systems or a CTO adding the data team to ‘fix-it Fridays,’ these things matter. The good news is that data teams have momentum and are starting to have the tools they need to build reliable systems. However, they need to stay focused on the value they create, closely balancing the need for reliability with the criticality and use cases of their data products.

.png)
.png)