High-impact data governance teams

The best analogy for high-impact data governance teams is that of a well-functioning kitchen. They help keep the kitchen clean, ensuring all knives are sharp and that everything is in the right place. This makes the chefs work faster, leads to fewer mistakes, and prevents a bad food hygiene rating.
But data governance teams are walking a fine line. If they’re not careful, initiatives may seem like extra overhead, introducing policies and processes with little business impact.
In this article, we look at the areas high-impact data governance teams should focus on and specific steps they can take.
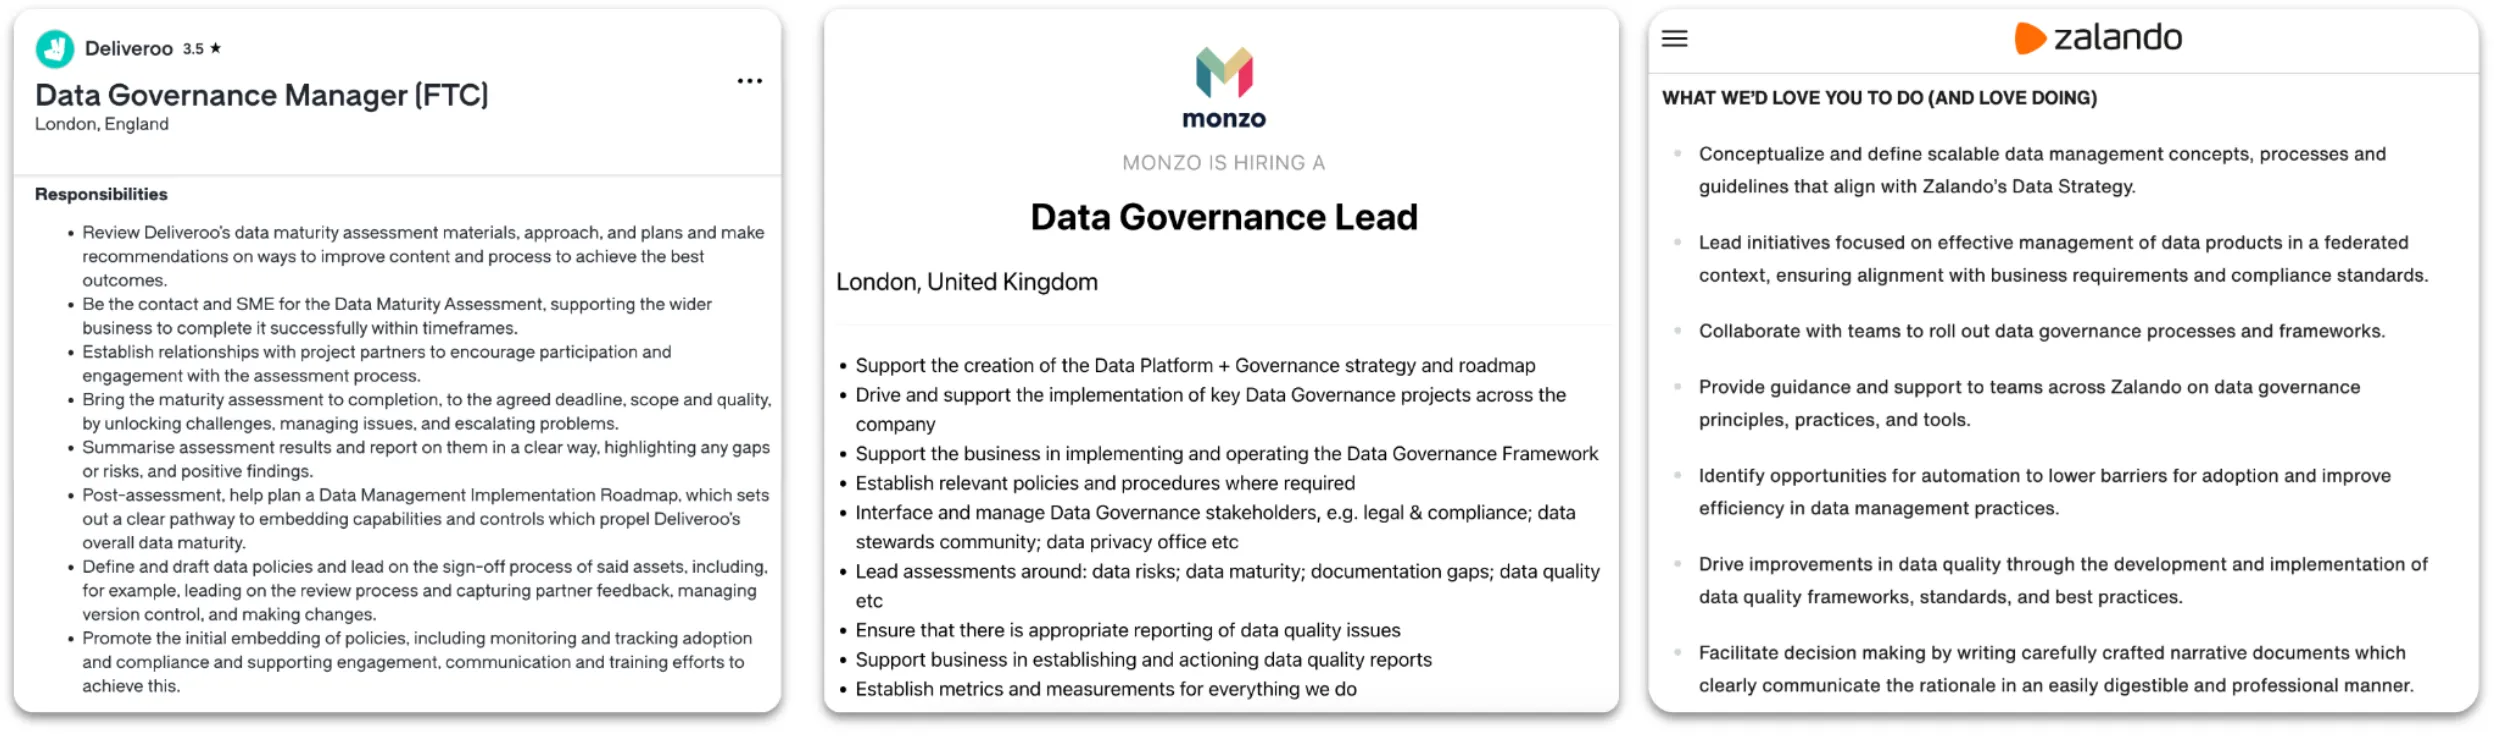
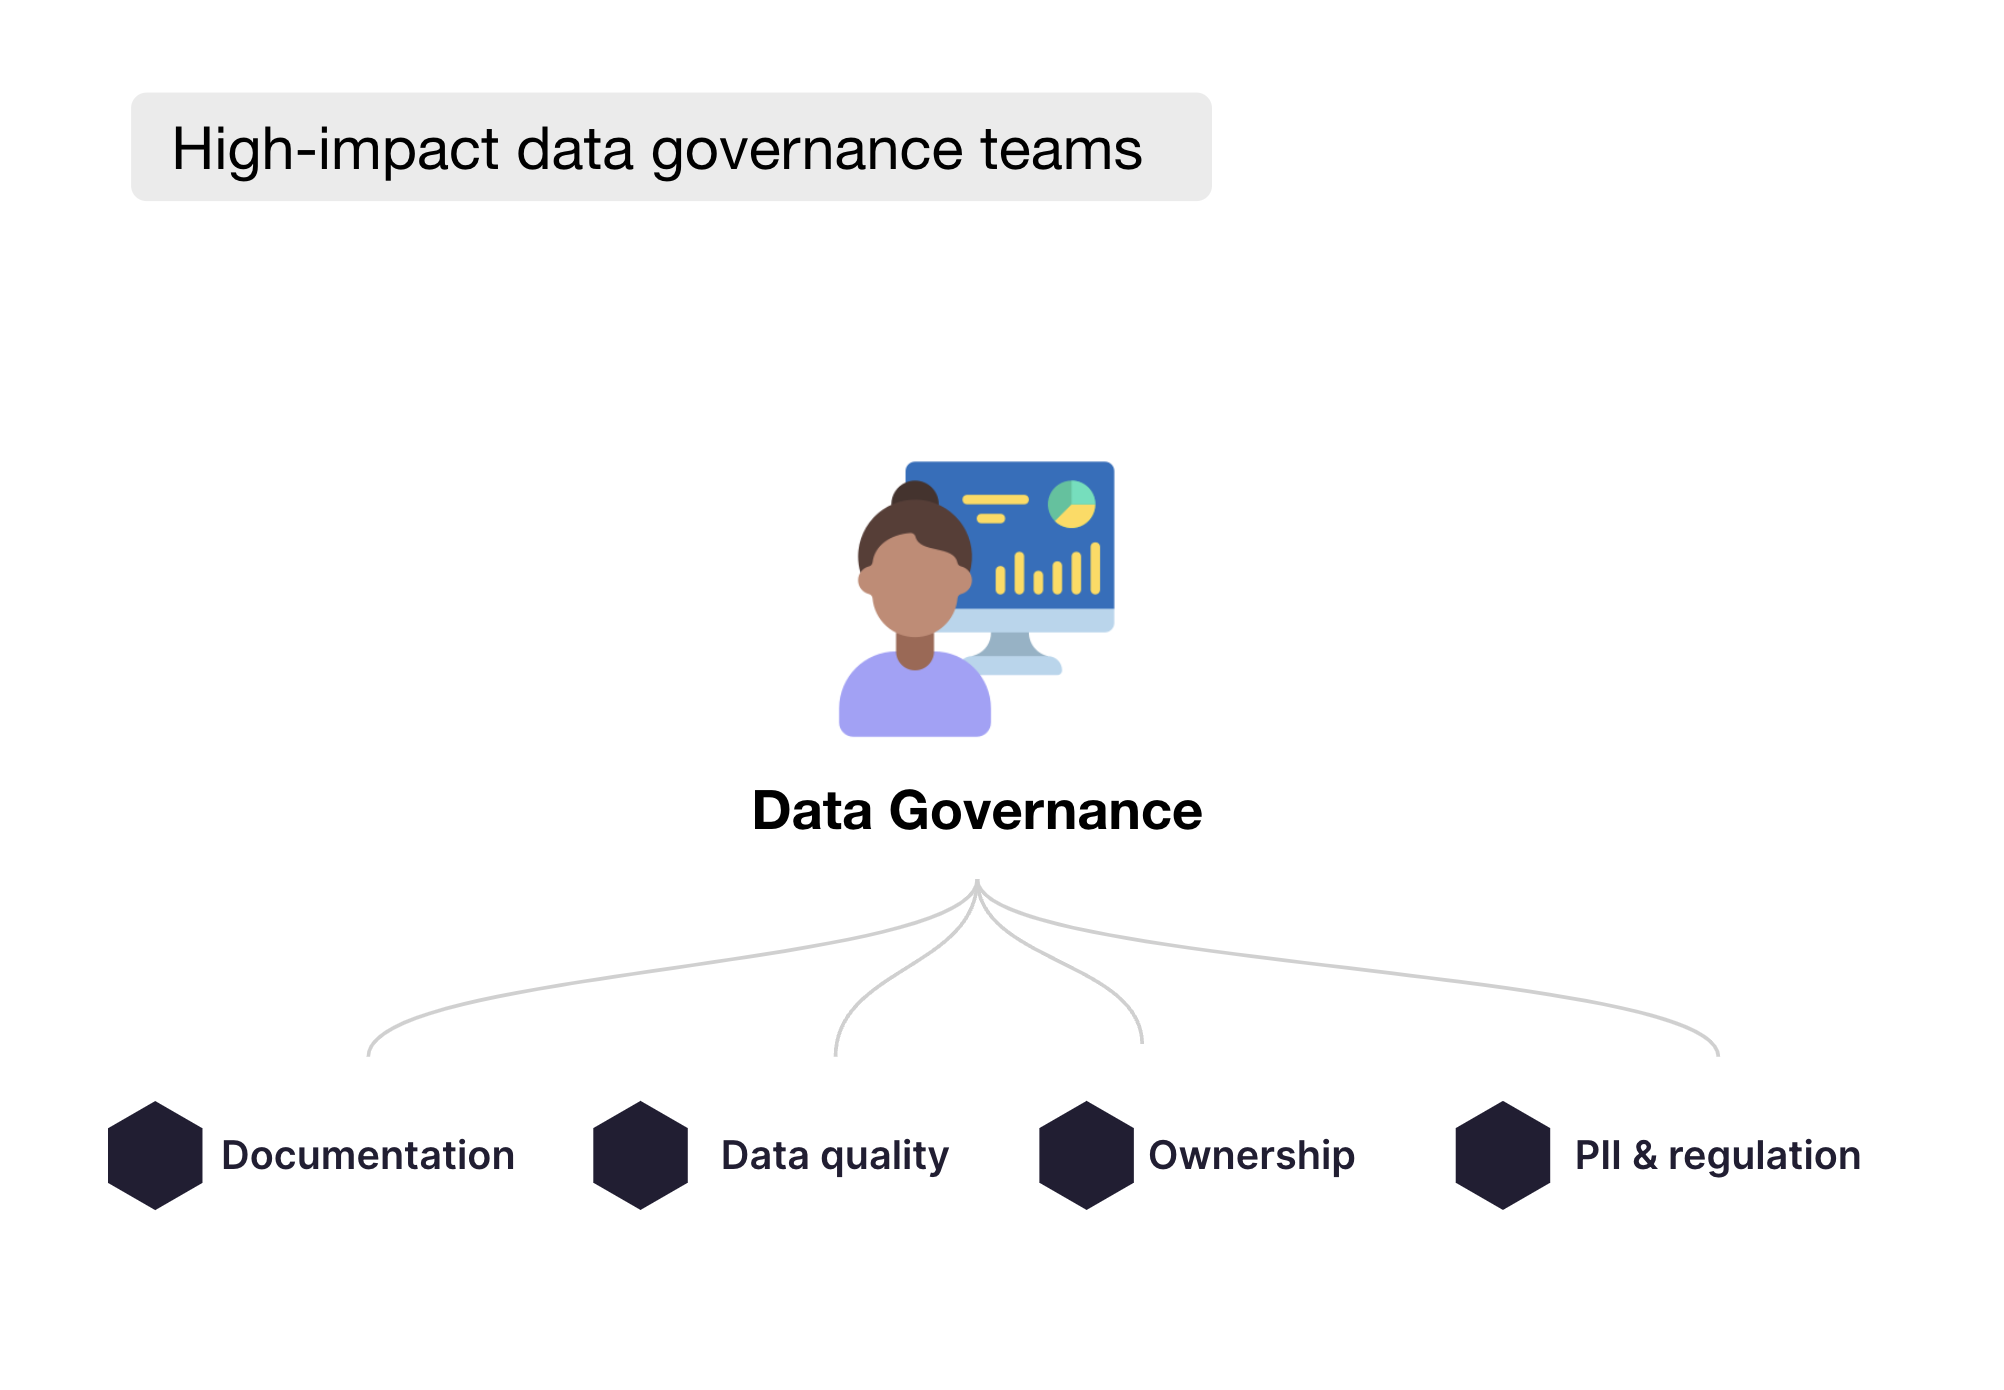
While there’s no one-fit-all solution to how data governance teams should work, these key themes persist as requirements in most job listings at top companies.
- Make data useable across the organization
- Keep a tab on the data quality, helping systematically improve what matters most
- Ensure responsibilities are clear through an ownership model
- Manage risk, privacy, and regulatory compliance
Make data useable across the organization
The problem is rarely that there’s not enough data. It’s that the existing data is not being used or that people can’t find it. As organizations grow, the amount of data being created significantly increases. Over time, this has several consequences.
Multiple definitions of the same metrics can cause people to lose trust in data or reach different conclusions.
Multiple dashboards or tables exist, solving the same problem and leading to redundant work and a less usable data stack.
Dashboards “rot” over time without stakeholders being aware.
The data stack explodes, making discovery difficult and adding unnecessary data platform costs.
This happens slowly and then all at once.
Sporadic efforts across teams to address this rarely work. The data governance team is uniquely positioned to help standardize and drive this.
Document key data assets
The data governance team should set and enforce expectations for data documentation so it doesn’t become an afterthought. For example:
- Enforce that documentation is done in the data catalog or in dbt yml files to create a consistent approach across teams.
- Set expectations that documentation should be done on all ‘gold’ standard tables but that ‘bronze’ and ‘silver’ are optional.
- Give clear examples of a well-documented table or field (e.g., write ‘user IDs for customers defined by their SalesForce identifier‘ instead of ‘user IDs of customers’).
Ensure key metrics are defined consistently
After a certain scale, you inevitably run into different definitions of the same metric. While the underlying data may not be incorrect, it leads to slower decision-making and causes time spent in meetings to be spent discussing if the metrics are correct instead of what to do about it.
The data governance team should set clear guidelines. One such guideline could be: “Key metrics should be defined in dbt instead of a calculated field in the BI tool to improve visibility and have version control.” Another guideline could be that key metrics include RAG (red, amber, green) thresholds alongside their metric definitions to keep these in one place. This has the added benefit of allowing you to set up automated alerts to relevant stakeholders if a threshold is breached.
Data governance teams should look for multiple definitions of the same metric and encourage teams to consolidate metrics if they spot multiple definitions. This is best done by regularly assessing key dashboards, Slack channels, and other places where KPIs are used.
Ensure data is discoverable
If your data consumers – whether inside or outside the data team – can’t find their data, it may as well not be there. If finding the data you need feels like searching for the needle in a haystack, part of the solution may be updating your toolset and bringing in a data catalog to make all data assets discoverable. But no tool will help if you don’t get the basics right first.
The data governance team should enforce simple but standardized conventions. For example, clear naming conventions for data assets, such as ‘⭐️ Product A/B test tracking [business banking]’ for dashboards, to make it clear that the dashboard is critical (⭐️) and what domains it belongs to (business banking).
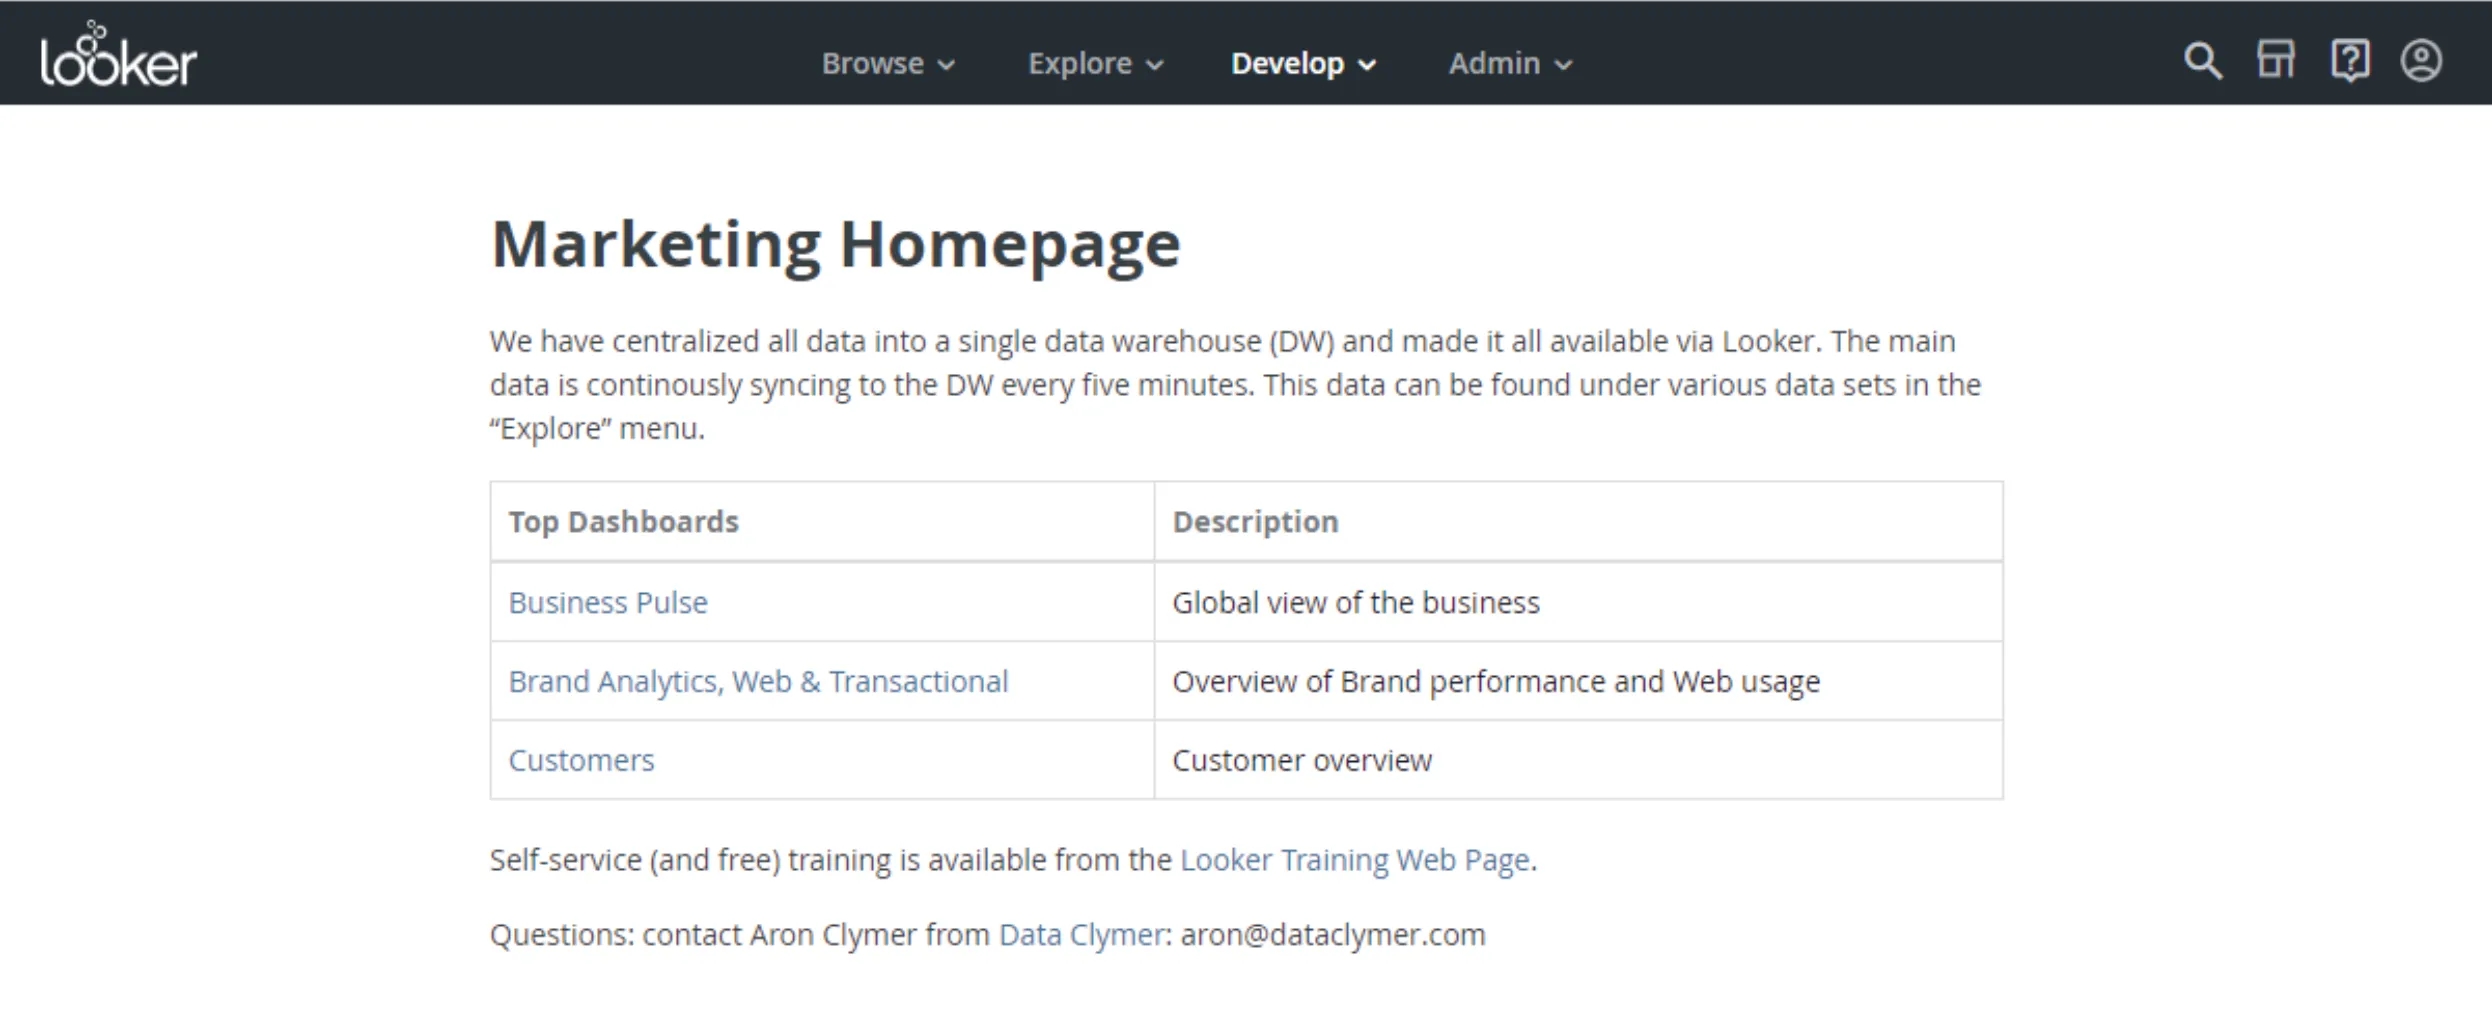
We recommend getting this as close as possible to where the data lives. If you use a BI tool like Looker, most data consumers will consume data here. Creating a well-structured ‘home page’ where you can dive into each domain with links to the most important dashboards is a good way to organize your dashboards and ensure everyone can find them.
Enforce the usability of dashboards
Like it or not, no matter how fancy data models and pipelines you create, stakeholders’ experience consuming the data in dashboards will heavily influence their perception of the data and your team’s output. You should treat dashboards like products, enforcing their look, feel, consistency, and performance.
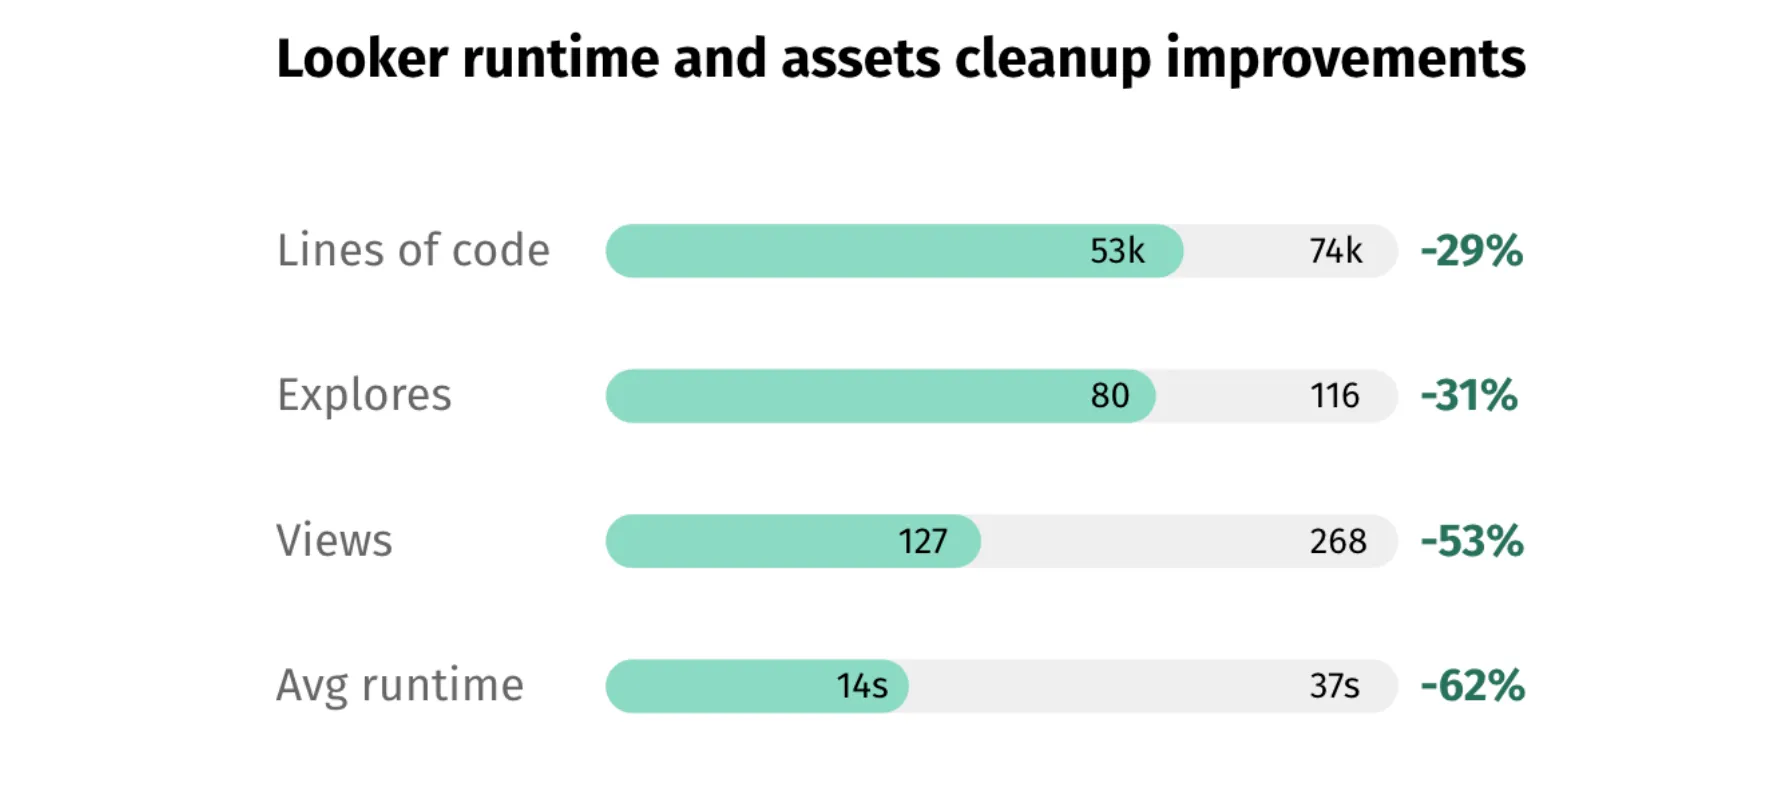
“Our fast growth led to many layers of convoluted logic in Looker. As a result, dashboards took minutes to load, and maintaining LookML was a constant struggle. Certain combinations of dimensions and fact tables would produce nonsense results if the query ever even finished.” - Ilmari Aalto, Analytics Engineer at Typeform
Typeform went the extra step to measure the Looker improvement as they went through a clean-up. Read how they did it here.
Remove unnecessary data assets
Data asset sprawl is one of the top reasons data becomes unusable over time. The most impactful initiative to declutter your data stack is getting rid of data assets that are not needed. While there’s no set definition of unneeded data assets, signs you can look out for are
- Dashboards with low usage
- Dashboards that have a large overlap with other dashboards
- Data models with no downstream dependencies
- Columns in data models that are not used downstream
Decluttering a bloated data stack is no easy task, and if possible, you should invest in getting rid of unused tables, data models, columns, and dashboards on an ongoing basis. However, many scaling companies find themselves on the back foot and only address this once they have thousands of data models and dashboards.
Here’s a real-life story from a scaling company to dramatically reduce the number of Looker dashboards, which made self-service nearly impossible
- The data team created a Looker dashboard for Looker usage and scheduled a monthly report to be sent to the #data-team slack channel (Looker lets you access this data in the System Activity Explores). The report contained a) the number of dashboards, b) the number of looks, c) the number of users, and d) the number of exec (VP/C-level) users.
- The dashboard lets you sort by owner domain and usage to quickly see which dashboards were unused and who were best placed to call if they could be deleted.
- The team introduced the concept of “tiered dashboards.” An example of a tier 1 dashboard could be a board-level KPI dashboard. A tier 3 dashboard could be one for a small product team. They made specific requirements for tier 1 dashboards around design consistency, peer review requirements, and usage monitoring.
- If executive users regularly used a dashboard that was not tier 1, that dashboard was reviewed to tier 1 standards.
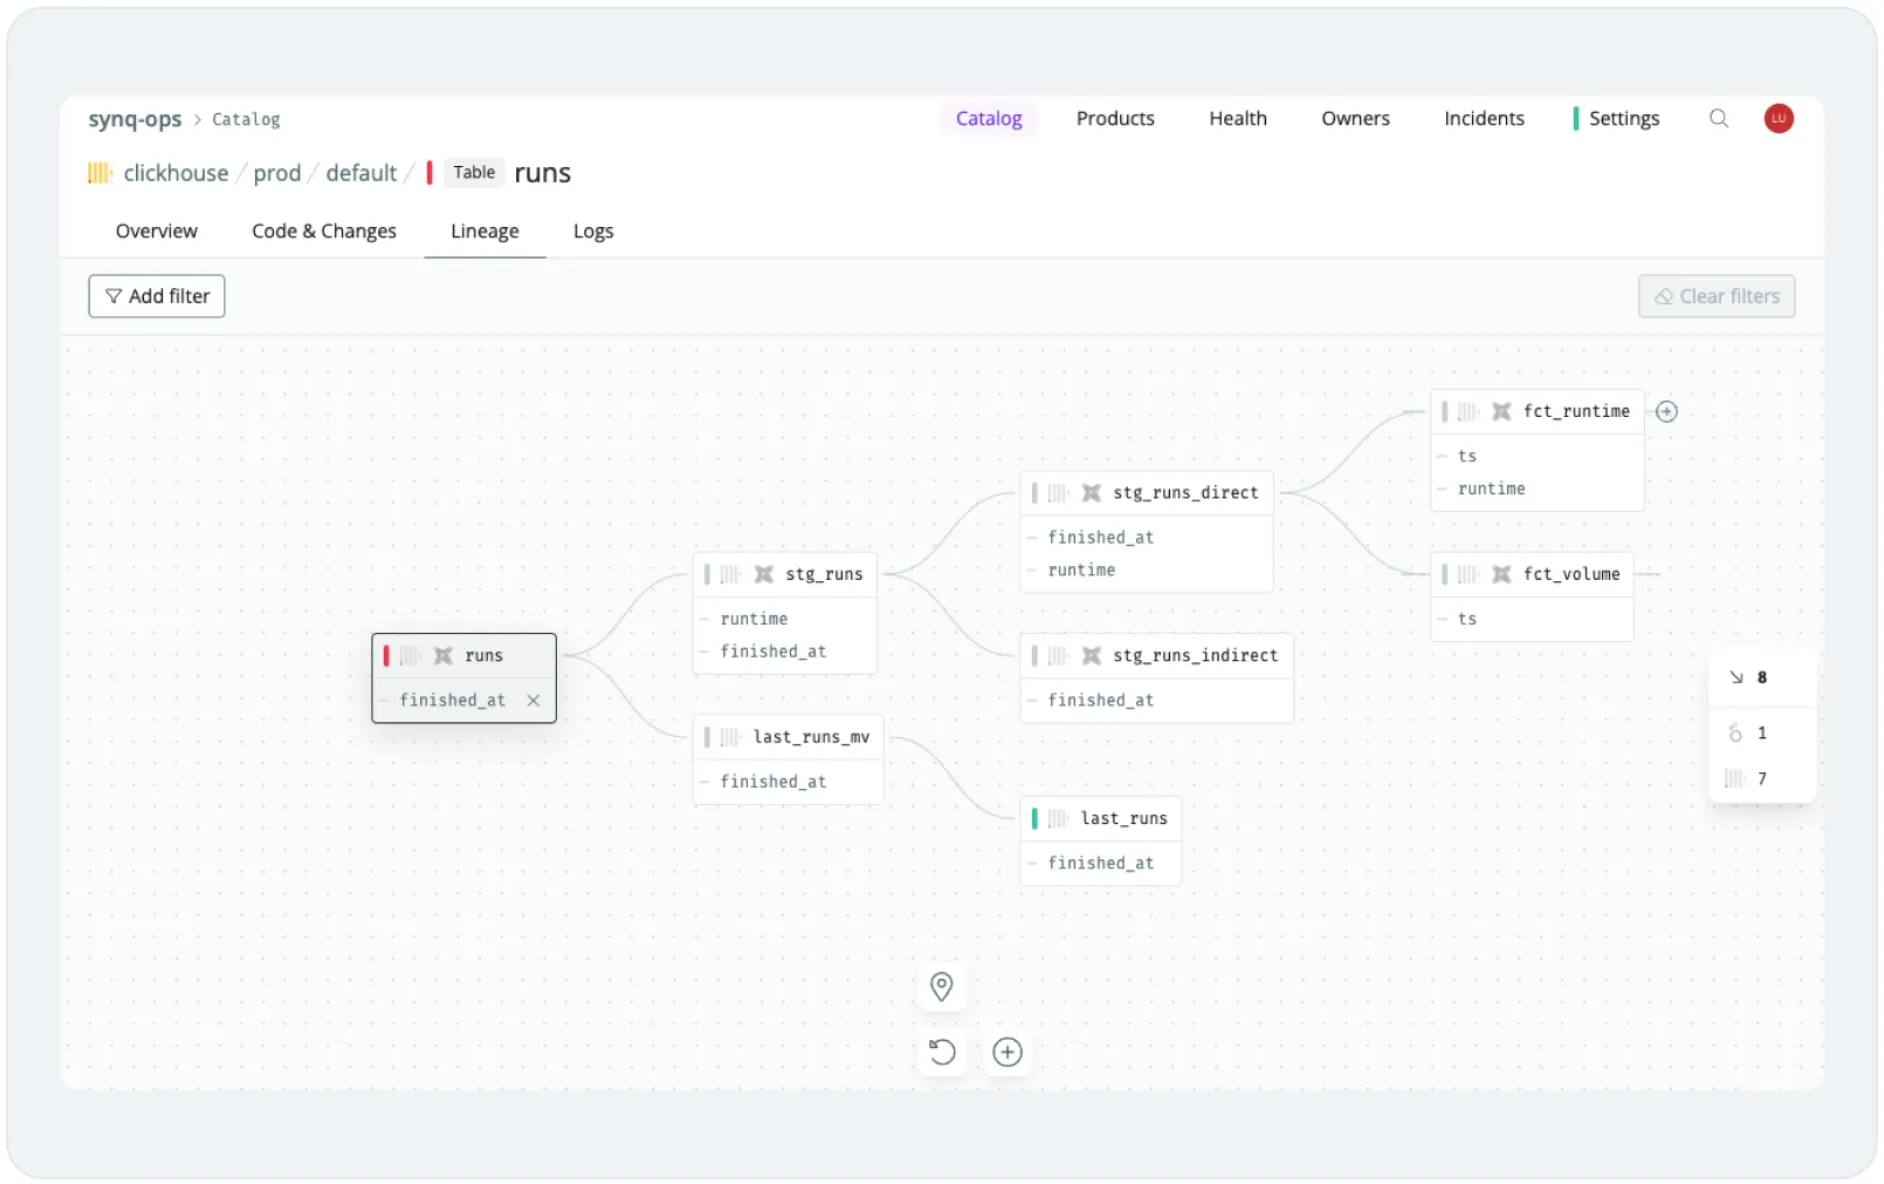
You can apply many of the same steps if you’re working on decluttering your data models in dbt. We’ve seen teams particularly benefit from having a well-mapped column-level lineage that extends from dbt to their BI tool. This helps you quickly and confidently assess the full downstream impact of deleting a data model or column.
Define what data is important
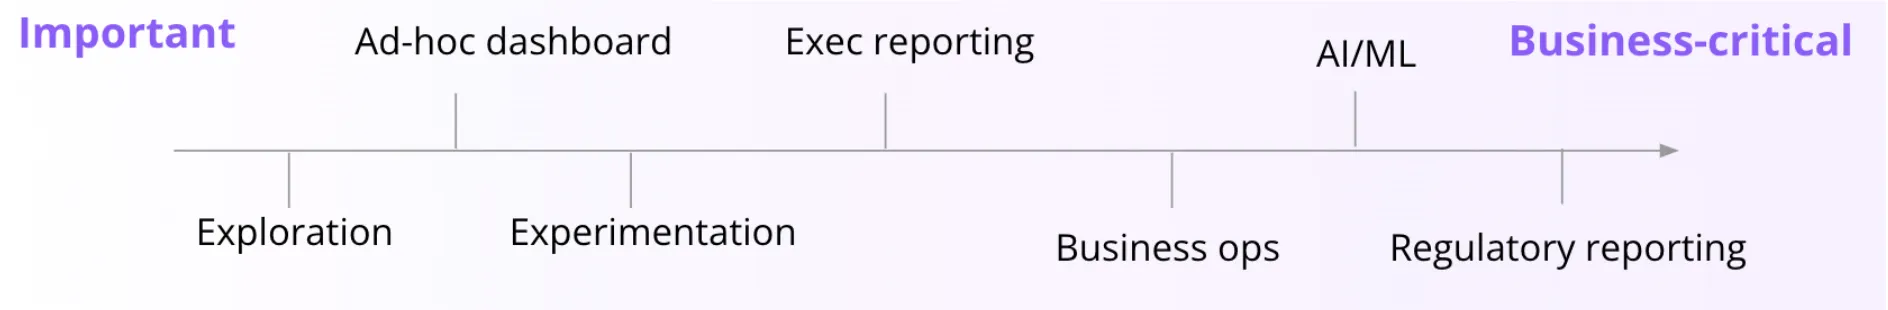
With scale, no matter how good the data governance team’s intentions, enforcing high usability across all data in the organization becomes impossible. It’s up to the data governance team to set clear expectations on how data criticality should be defined and what the implications are. For example, using a ‘bronze, silver, gold’ model and deciding that only silver and gold should comply with the standards for documentation.
As you complete this exercise, it’s important to consider your data as a chain and map it back to downstream use cases.
Read our guide How to identify your business-critical data, for practical steps to identifying business-critical data models and dashboards and driving confidence in your data.
Keep a tab on the data quality, helping systematically improve what matters most.
Data quality is consistently ranked as the top challenge faced by data teams. dbt recently asked thousands of data practitioners about their top challenges, and with 57% of votes, poor data quality comes in at the top.
There are good reasons for this. Poor data quality leads to incorrect decisions, system failures, and eroded trust in data.
Fortunately, most data practitioners have grown accustomed to well-tested data being part of developing data assets. That works well for individual assets but leaves much up to the individual’s interpretation. We recommend that data governance teams systematically benchmark data quality across key dimensions such as owner domain and criticality.
Data quality reporting
There are many reasons to report on data quality, but asking each team to define their own metrics is a guaranteed recipe for confusion. Consistently measuring and communicating data quality can have several business outcomes:
Getting distributed teams to take ownership of data quality by highlighting problematic areas
Showing confidence to stakeholders after repeated questions about data quality being perceived as low
Showing regulators that you’re on top of data quality
Sharing system uptime with engineers on a data product where you’ve committed to an SLA
- Uptime – what % of controls in place are passing successfully at each run
- Coverage – what % of data assets have the required controls in place
Grouping your quality metrics into semantically similar areas lets you talk about data quality in a way that’s closer aligned to the business use cases. (1) Timeliness–is data fresh and up to date per the SLAs agreed with the business, (2) Correctness–is all data available, (3) Completeness–is data semantically correct, and (4) Consistency–is the available data consistent across systems. We also suggest clearly defining when something is “poor”, “ok”, or “good”. In our example, any score below 50% has been marked as “poor, ” meaning an action is required.
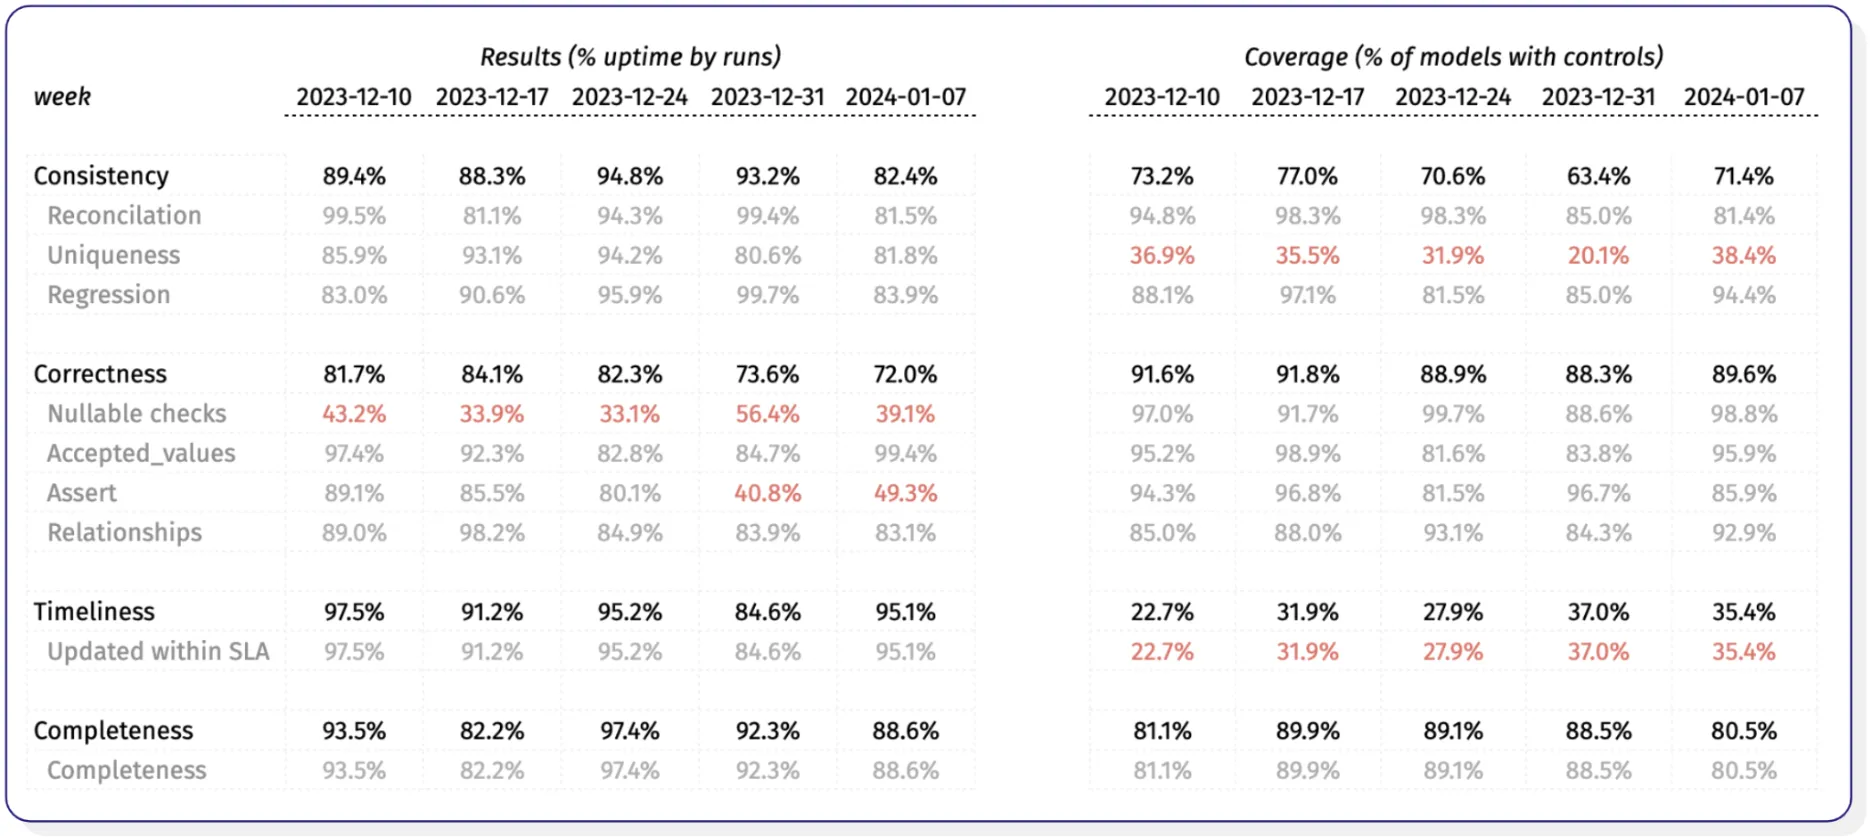
This level of insight lets you start asking questions about your data quality, such as
While we’ve got good coverage of null value checks, we should investigate which ones are failing, whether they can be fixed, and whether we should remove them.
Why has the uptime of our assertion tests significantly declined?
Given the low coverage, does our high uptime on uniqueness tests give us a false sense of security?
For more guidelines on how to measure data quality, see our guide Measuring data quality: bringing theory into practice
Set guidelines for data quality expectations
In most scenarios, you want to specify expectations depending on how data is used. We recommend doing this as you may not want to hold all assets accountable to the same standards. In the same way, as you may only enforce documentation on ‘gold’ assets, the data governance team should play the role of setting guidelines for expectations for the testing of data. Keeping in mind what data is business-critical, what’s being exposed (e.g., in a dashboard), and what assets should have an SLA (e.g., if data doesn’t arrive on time, there are downstream ramifications) helps you assess which checks you need and thus measure what matters.

dbt yml files are a great place to define this metadata. This lets you use CI checks, such as check-model tags from the pre-commit dbt package, to ensure that each data model has the necessary metadata, such as a criticality or domain owner tag.
Ensure responsibilities are clear through an ownership model
As the data stack grows in complexity, it’s no longer possible for one person to keep everything in their head, and more often than not, the person who notices a problem is not the right person to fix it. Simultaneously, the number of upstream and downstream dependencies has exploded, making it challenging to locate the right upstream owner or notify impacted stakeholders.
You don’t have to ask many data teams to understand the dream state: A world where upstream producers own and manage the quality of their data, where the relevant data teams take responsibility, and where the days of stakeholders discovering issues are over.
Good ownership is easier said than done, and there’s no shortage of failed ownership initiatives.
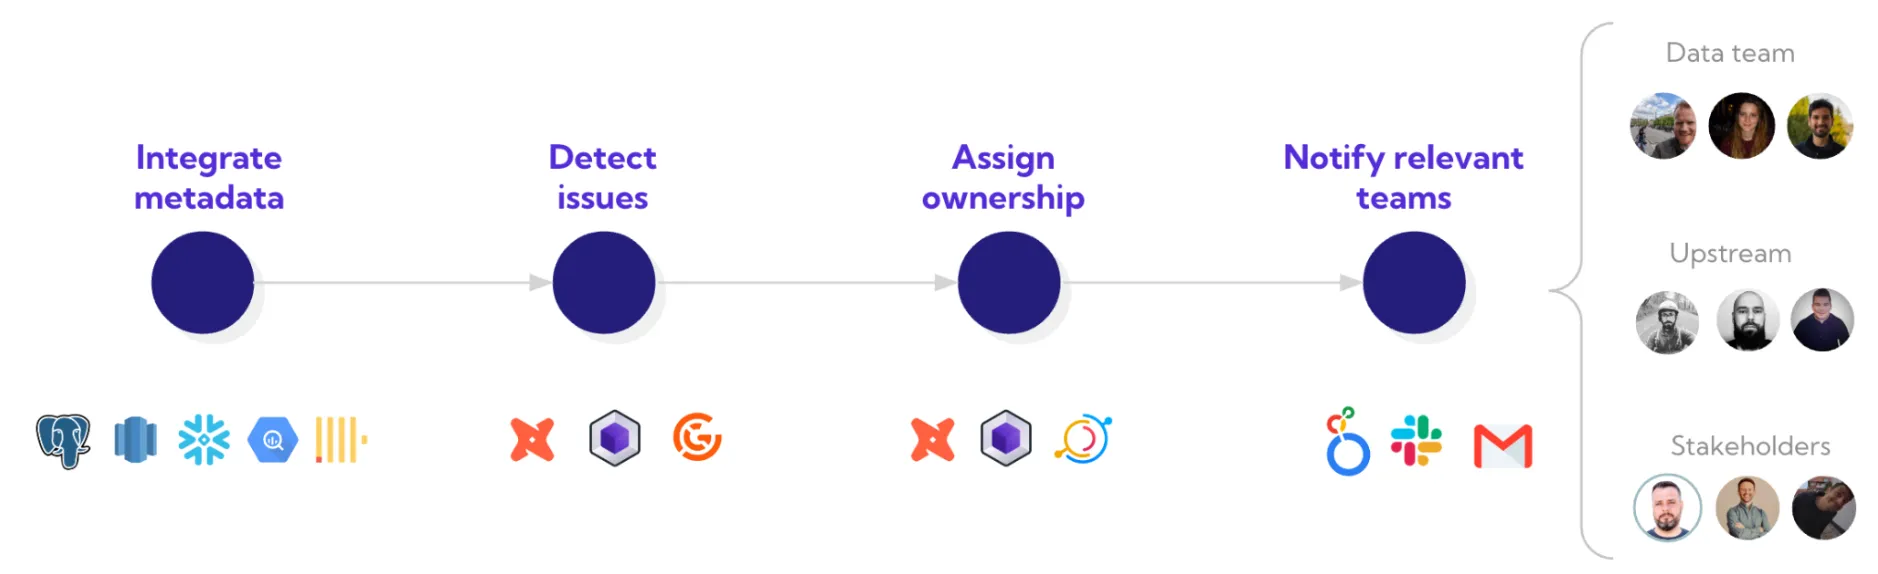
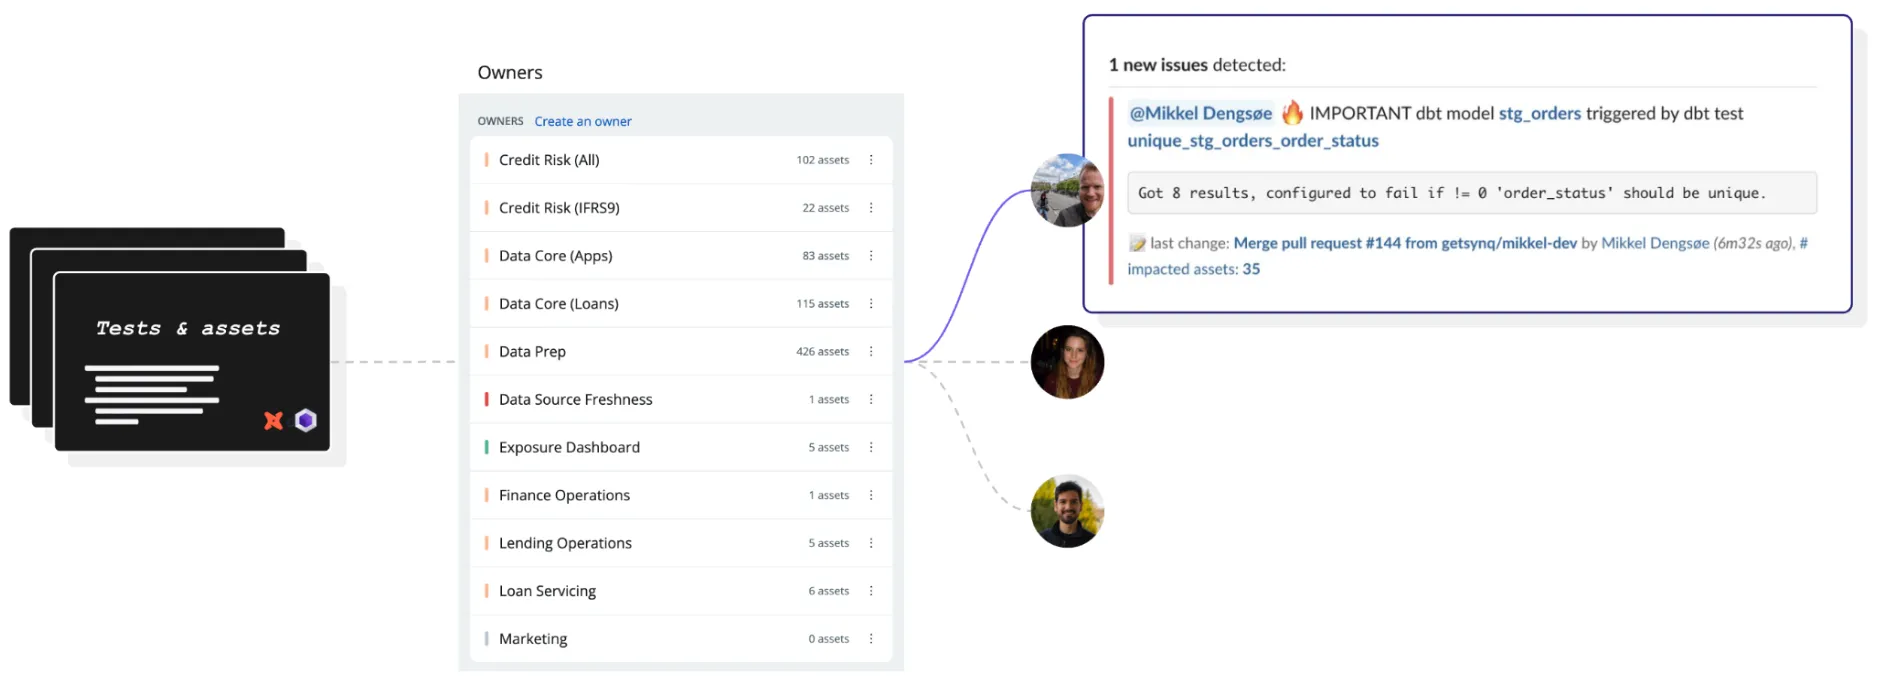
The data governance teams are ultimately responsible for building a consistent ownership model with clearly defined roles and responsibilities. Breaking it into steps makes it clearer where you have gaps: (1) consolidate your metadata, (2) detect issues with relevant tests, (3) assign ownership, and (4) notify the relevant people of issues in a way where they can take action.
Ownership is as much a cultural as a technical challenge, and succeeding with ownership initiatives requires focusing on both.
- Setting expectations for owners – expectations should be linked to the importance of the data asset. For example, what makes a high-severity issue, and who decides. See Designing severity levels for data issues for more details on how to get started.
- Defining ownership – there’s no shortage of places you can define ownership, from dbt yml files to data catalogs, Confluence pages, and spreadsheets. Be clear about expectations for where ownership should be defined and help everyone do it in the same way.
- Notifying the right people with the right context – We recommend you consider data ownership holistically – from data sources owned by upstream teams to dashboards owned by end-users. For simplicity, we’ll group our recommendations into these groups: (1) data team, (2) upstream teams, and (3) business stakeholders.
- Overcoming cultural ownership challenges – One thing is being assigned as an owner, and another is being held accountable. Succeeding with ownership is as much a cultural challenge as a technical one. Influencing and holding people accountable is a big win for any data governance team. Consider dimensions such as getting senior buy-in to act on ownership and finding the right areas to start by defining ownership to demonstrate early wins as essential as the technical implementation.
Read our guide Data ownership: A practical guide, for a full toolkit for defining and activating ownership across the data team, upstream teams, and business stakeholders.
Manage risk, privacy, and regulatory compliance
At certain points in a company’s lifecycle, typically when a data governance team is brought in, there’s significant risk to manage. This may involve regulatory data for a fintech, the accuracy of financial data for an upcoming IPO, or a general sense that the company needs to handle PII data responsibly.
Your job here as a data governance professional is clear: ensure the company complies with its obligations and minimizes risk without slowing down the data team.
Here are a few ways you can do that
PII-related data–In most companies, some data, such as user emails, shouldn’t be readily available for everyone to query. Enforce that data is tagged as PII and automate guardrails around this data. For example, create a separate data warehouse with the raw data where access is only given per use case and expires after, e.g., seven days.
User data deletion requests–If you work with user data, you’ll inevitably encounter user data deletion requests. The sooner you think about these, the easier it will be to delete all user data when your first request comes in. Having the right tooling, such as column-level lineage, in place before this happens will significantly reduce the time it takes.
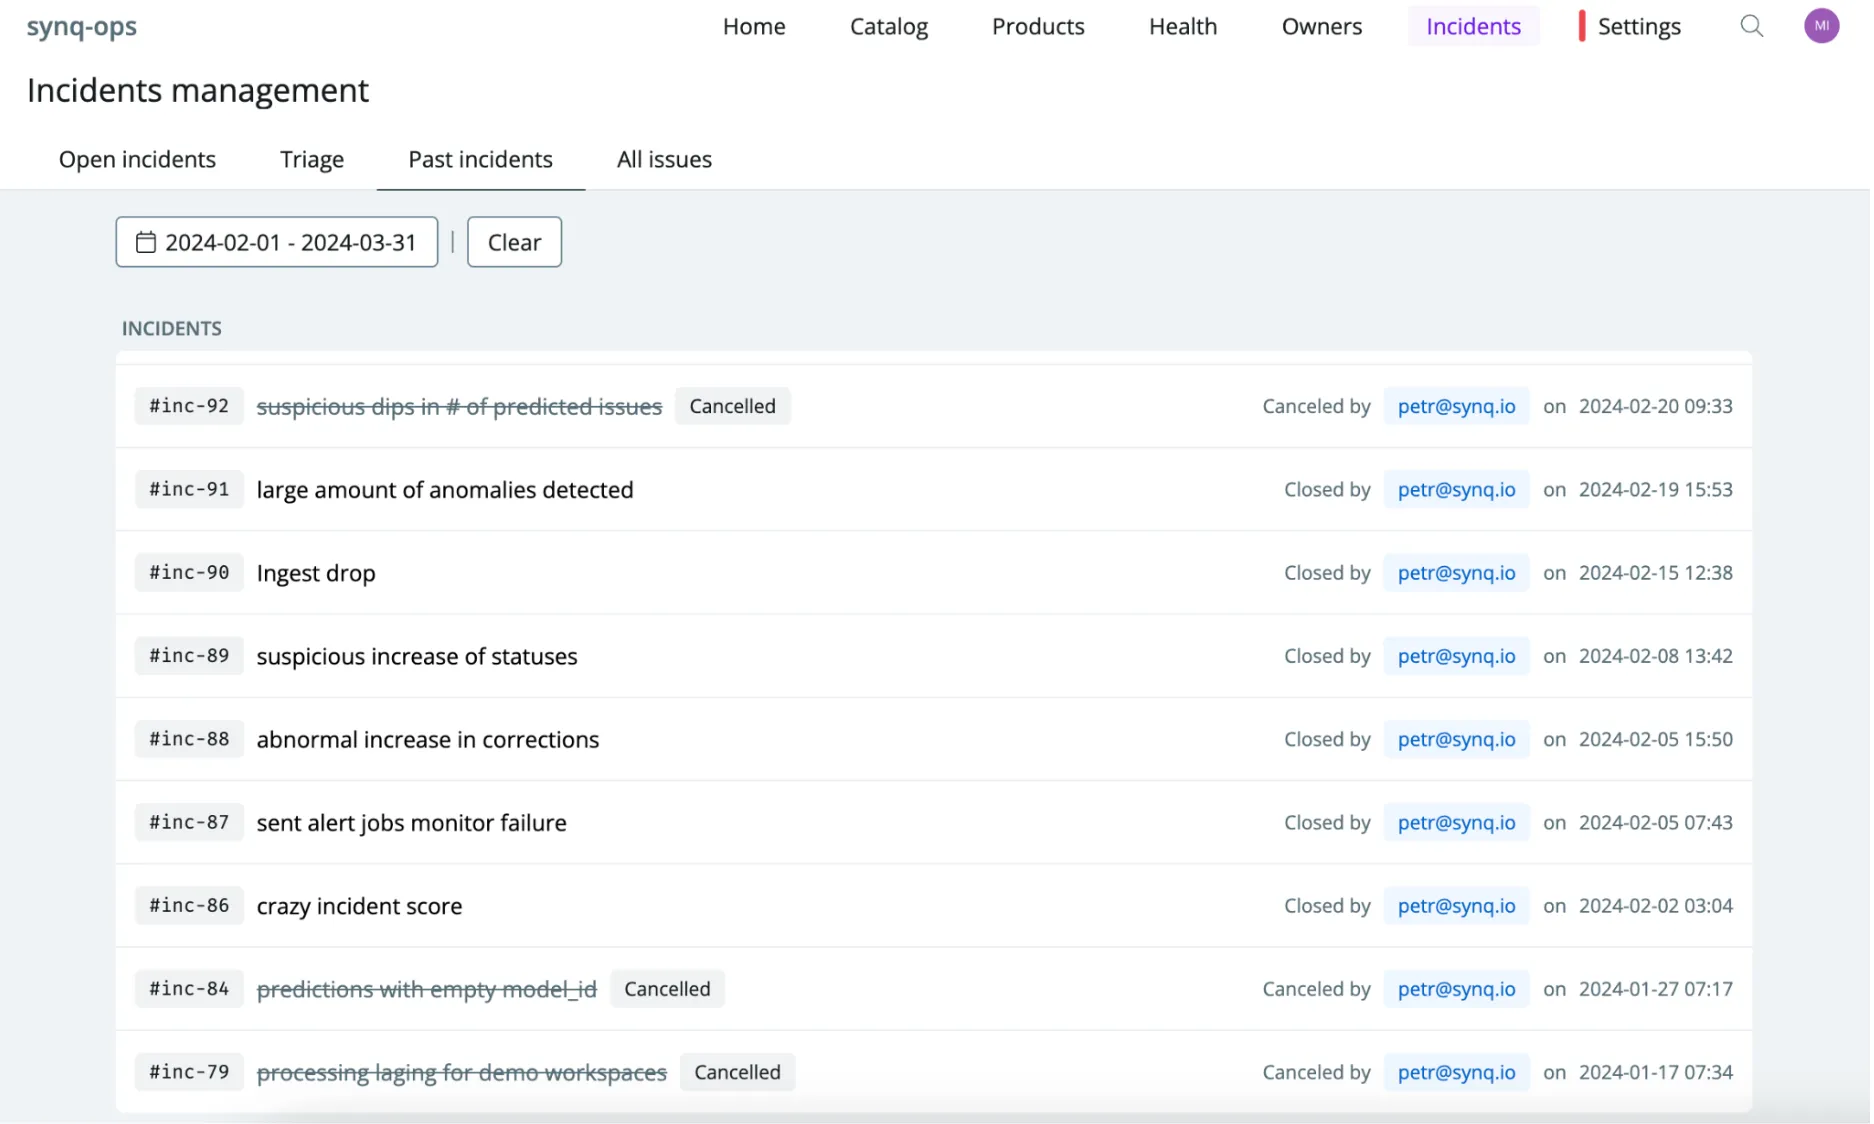
Define incident management processes and SLAs–Data issues will happen no matter how good your ownership model or data quality checks are. A well-defined incident management process has multiple benefits: it helps everyone build a shared understanding of what’s important, it makes it easier to bring in people with little or no context about the issue, and you can more easily look back on past incidents, and report on critical breaches.
Key skills to navigate as a data governance professional
Making data usable, ensuring quality, building ownership, and balancing PII and risk with speed—this is no small task for a data governance team! Below are some essential skills required for data governance professionals to succeed.
Technical understanding–While you may not be contributing to the code base and writing dbt models yourself, having a high-level understanding of the tools data teams use, and their limitations are beneficial. This helps you better understand other teams’ pain points and the pros and cons of how data governance processes fit into existing workflows.
Balancing priorities—It may feel like everything is always important. Still, it’s your job to keep an eye on what’s happening across the company that makes certain initiatives take priority. For example, near an upcoming IPO or a regulatory breach, it may make sense to fully focus the governance initiatives on finance data while paying less attention to marketing and product domains.
Running a vendor selection process–You’ll likely want to bring in at least a few tools to help you solve the problems above. You should keep a tap on tools in categories such as data catalogs and data observability tools. If you decide to invest in a tool, it’s up to you to run a well-structured process, plan the proof of concept, and ensure everyone on the data team feels heard. It may be the first time your company buys a tool in this category, so getting multiple demos and running reference checks with existing customers can be a good way to test if the tool will work for you before you commit.
Organizational buy-in–Nobody cares about data quality, documentation, or ownership for the fun of it. As the data governance team, you should sell the dream of why documentation, data quality, and ownership matter. Regularly sharing insights with the leadership team is a good way to ensure they have skin in the game and understand why these investments are worth it.
“Every three months, we meet with the chief risk officer, chief technology officer, and bank CEO to update them on the latest developments, risks, and opportunities. This helps everyone contribute to and have a stake in our data quality“ — Casper, Director of Data a Lunar.
Putting it all together
The role of the data governance team is to keep the kitchen clean, ensure that all knives are sharp, and ensure that everything is in its place.
This is no easy task and involves balancing priorities, involving stakeholders, and running vendor selection processes. A good example of what happens when this is done well is the Danish fintech Lunar, who successfully rolled out a data governance framework—from ownership to criticality and monitoring—and got C-level buy-in. Read their story here for inspiration on structuring data governance into a framework.
Summary:
- Make data useable across the organization – this includes ensuring that data is well documented, key metrics are defined consistently, key data assets are discoverable, and dashboards look, feel, and perform well.
- Keep a tab on the data quality, helping systematically improve what matters most – while the data governance team may not be writing data tests, they can help enforce expectations and report on data quality to improve it systematically.
- Ensure responsibilities are clear through an ownership model – key aspects around ownership, such as how it’s defined and actioned and what expectations are for owners, should be defined centrally by the data governance team so each team doesn’t make their own interpretation.
- Manage risk, privacy, and regulatory compliance – often seen as one of the less glamorous areas, unclear processes around PII data, user deletion requests, and incidents are a recipe for disaster down the line.

.png)
.png)